A newer version of this document is available. Customers should click here to go to the newest version.
Windows* Targets
Use the Intel® VTune™ Profiler for the performance analysis of Windows* targets.
Prepare a Windows Target for Analysis
Before you begin analyzing your target for performance, you need to configure and build it as follows:
Enable downloading debug information for the system libraries by configuring the Microsoft* Symbol Server.
Enable debug information generation for your application binary files.
Build your target in the Release mode with the recommended compiler optimization settings.
Create a baseline against which you can compare the performance improvements as a result of tuning.
For example, you instrument your code to determine how long it takes to compress a certain file. Your original target code, augmented to provide these timing data, serves as your performance baseline. Every time you modify your target, compare the performance metrics of your optimized target with the baseline, to verify that the performance has improved.
Choose a Target from Visual Studio* IDE
For the VTune Profiler integrated into the Microsoft Visual Studio* IDE, you may choose an analysis target and run a performance analysis directly from your development environment.
To choose an analysis target for an existing solution:
Open a solution in the Intel VTune Profiler Results folder. To display the folder, in the Visual Studio IDE, select View > Other Windows > Intel VTune Profiler Results.
If the solution contains more than one project, select an appropriate project.
VTune Profiler toolbar and menu items are enabled. By default, the VTune Profiler inherits the Visual Studio settings and uses the application generated for the selected project as your analysis target. You may right-click the project and select
 Configure Analysis toolbar button to verify target properties from the menu. By default, the target type is set to Launch Application.
To choose an existing standalone executable file:
From the Visual Studio menu, choose File > Open > Project/Solution.
The Open Project dialog box opens.
Select the Executable Files (*.exe) filter and choose an executable file.
Visual Studio software creates a solution with a single project that contains your executable file. VTune Profiler features are enabled.
Right-click the project and select Intel VTune Profilerversion > Configure Analysis... option.
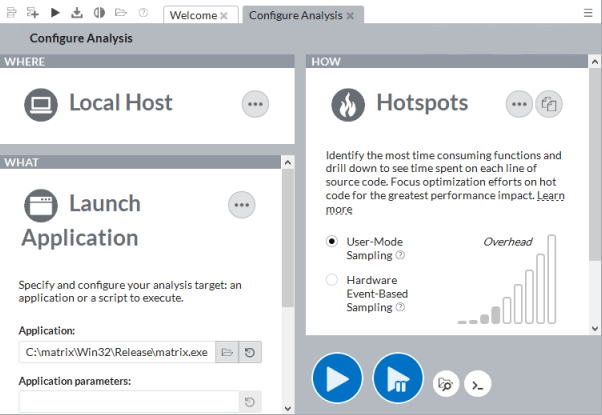
The Configure Analysis window opens.
Click the Binary/Symbol Search or Source Search button at the bottom to specify search directories. By default, the search directories are defined by the Microsoft Visual Studio* C++ project properties. To view default project search directories for system functions in Visual Studio, right-click the project in the Solution Explorer and select Properties.
When finalizing the collected data, the VTune Profiler uses these directories to search for binary (executables and dynamic libraries), symbol (typically .pdb files), and source files supporting your target in the particular order. VTune Profiler automatically locates the files for C/C++ projects which are not moved after building the application and collecting the performance data.
Save the solution.
Different versions of Visual Studio may have different user interface elements. Refer to the Visual Studio online help for the exact user interface elements that you need to view file location.
Configure a Windows Target
When creating a VTune Profiler project, you access the Configure Analysis window and select any of the three available target types for further configuration: Launch Application, Attach to Process, or Profile System. For example, for the Launch Application target type, you need to specify an application (and its parameters, if required) for analysis:

When done with the configuration, click the  Browse button on the HOW pane on the right to select and run an analysis type.