A newer version of this document is available. Customers should click here to go to the newest version.
NPU Exploration Analysis (Preview)
Use the NPU Exploration analysis to profile and optimize artificial intelligence(AI) workloads running on Intel architectures.
A Neural Processing Unit(NPU) can accelerate the performance of AI workloads that have been explicitly offloaded onto it by an operating system. NPUs are uniquely designed to improve the performance of AI and machine-learning(ML) workloads. Use the Intel® Distribution of OpenVINO™ toolkit to offload popular ML models (like speech or image recognition tasks) to Intel NPUs. Then use the NPU Exploration analysis to profile AI and ML workloads. Collect performance data and optimize the performance of these AI/ML applications.
This is a PREVIEW FEATURE. A preview feature may or may not appear in a future production release. It is available for your use in the hopes that you will provide feedback on its usefulness and help determine its future. Data collected with a preview feature is not guaranteed to be backward compatible with future releases.
NPU Data Collection Modes
When you run the NPU Exploration Analysis, Intel® VTune™ Profiler can collect hardware metrics about NPU performance in one of two ways:
- Time-based mode
- Query-based mode
Time-based mode |
Query-based mode |
|
|---|---|---|
How it works |
Intel® VTune™ Profiler collects metrics system-wide, similar to CPU uncore metrics. |
Intel® VTune™ Profiler collects metrics for each instance of a Level Zero inference. Metrics are collected system-wide but data collection is closely tied to the inference. The collection starts immediately before each inference and stops immediately after. |
Size of typical workload |
Large |
Small |
Execution time of instance |
>5 ms |
<5 ms |
Sampling interval |
Specify value between 0.1 ms and 1000 ms |
N/A |
Benefits |
Use this mode for larger workloads. Optimize applications with reasonable efficiency and reduced overhead. |
Use this mode for smaller workloads. Optimize application more efficiently, even if runtime is longer. Examine effectively if your workload is DDR memory bound. |
Usage considerations |
Less overhead for application. This mode requires Level Zero backend to be installed, with normal NPU drivers. However, the mode does not require the application to use Level Zero to collect metrics, except for computing tasks. |
More overhead for application. This mode requires the application to use Level Zero for the backend. |
Configure and Run Analysis
In the Accelerators group of the Analysis Tree in the VTune Profiler user interface, select NPU Exploration (preview).
In the WHAT pane, specify the path to the AI/ML application in the Application bar.
If necessary, specify relevant Application parameters as well.
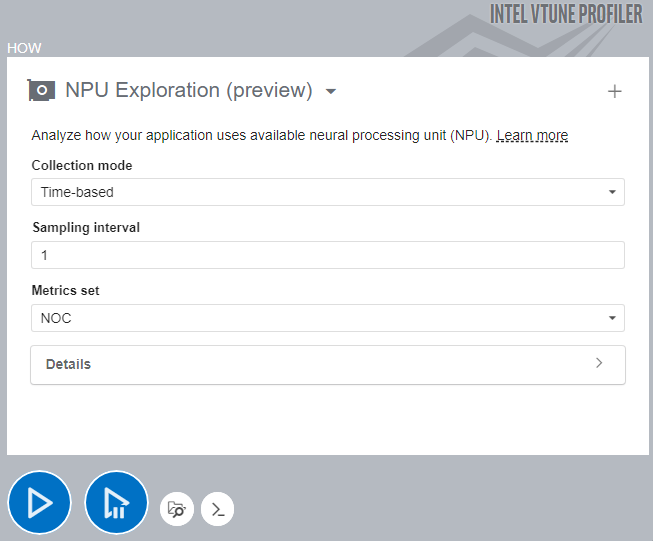
In the HOW pane, select a Collection mode.
Specify a sampling interval.

Click the
 Start button to run the analysis.
To run the NPU Exploration analysis from the command line, type:
$ vtune -collect npu [-knob <knob_name=knob_option>] -- <target> [target_options]
To generate the command line for any analysis configuration, use the Command Line button at the bottom of the interface.
Once VTune Profiler completes data collection, the results of the NPU Exploration analysis appear in the NPU Exploration viewpoint.