A newer version of this document is available. Customers should click here to go to the newest version.
Visible to Intel only — GUID: GUID-F46C2703-E00D-4D99-B4AD-A28B21DE3AC5
Visible to Intel only — GUID: GUID-F46C2703-E00D-4D99-B4AD-A28B21DE3AC5
macOS* Support
You can run Intel® VTune™ Profiler on a macOS* host system to launch a collection on a remote Linux* system or Android* system. You can also view the data collection result on the macOS host. However, Intel® VTune™ Profiler does not support data collection on a local macOS machine.
Prerequisites
See the Intel VTune Profiler Installation Guide - macOS for detailed information about installing and configuring VTune Profiler for use on a macOS host.
Install VTune Profiler on your macOS host.
Set up a SSH connection to your remote target. You may need to install the appropriate drivers on the target system:
Get Started
Launch the VTune Profiler GUI from the Launchpad or launch the command line collector by executing the amplxe-vars script and running the vtune command. By default, VTune Profiler is installed under the /Applications directory. For more information, see Standalone VTune Profiler Interface.
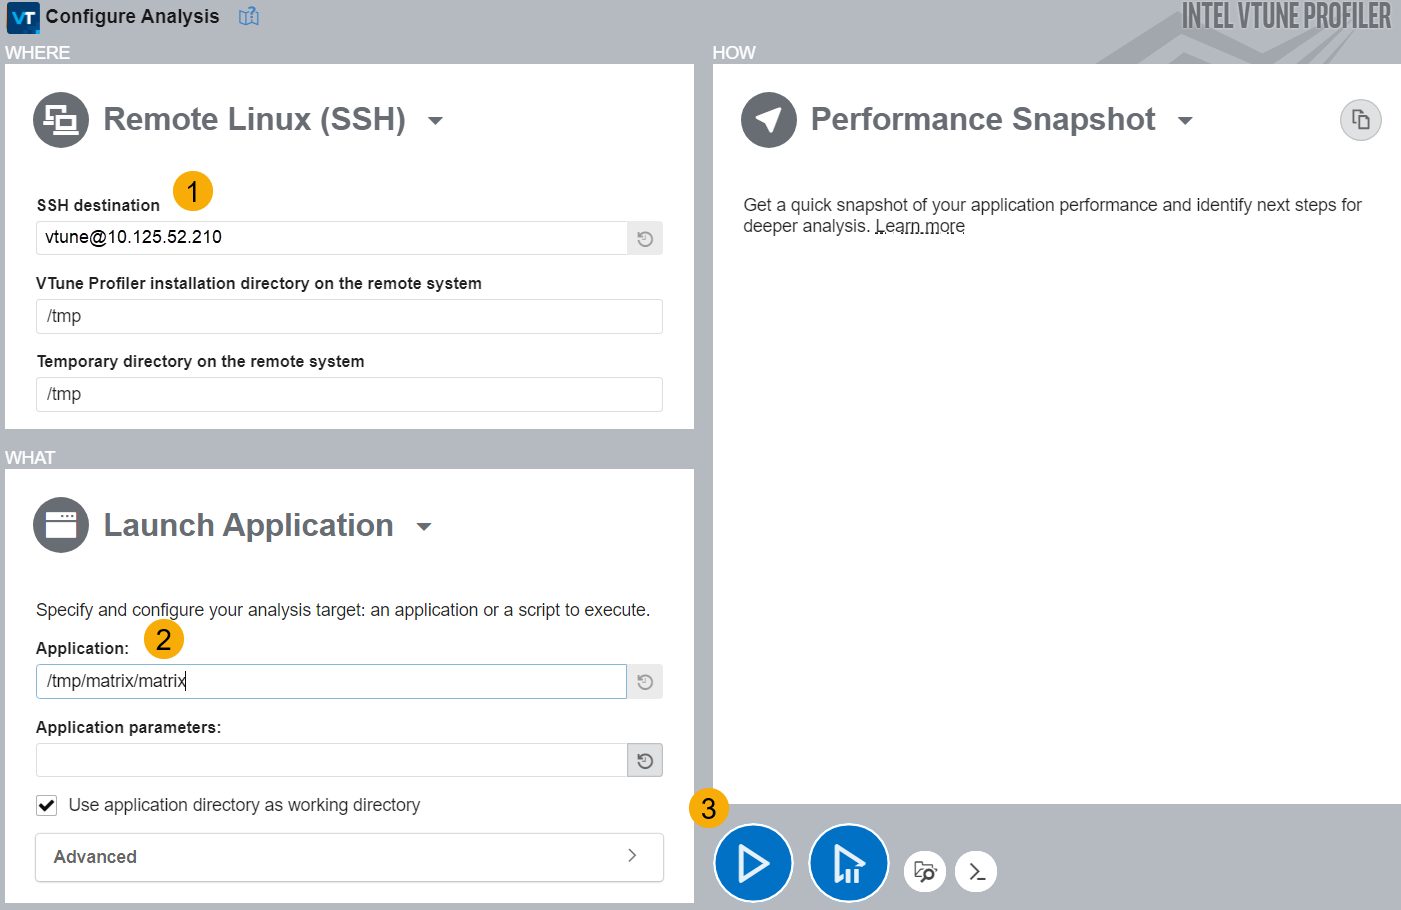
Click the Configure Analysis icon to set up your remote collection. This opens the Performance Snapshot analysis type by default.
 [/concept/conbody/section/ol/li/table/tgroup/thead/row/entry {"col1"})
Action
(entry][/concept/conbody/section/ol/li/table/tgroup/thead/row/entry {"col2"})Purpose
(entry][/concept/conbody/section/ol/li/table/tgroup/tbody/row/entry {"col1"})1
(entry][/concept/conbody/section/ol/li/table/tgroup/tbody/row/entry {"col2"})In the WHERE pane, select a remote Linux or Android target.
(entry][/concept/conbody/section/ol/li/table/tgroup/tbody/row/entry {"col1"})2
(entry][/concept/conbody/section/ol/li/table/tgroup/tbody/row/entry {"col2"})In the WHAT pane, provide the path to your application on the target Linux system.
(entry][/concept/conbody/section/ol/li/table/tgroup/tbody/row/entry {"col1"})3
(entry][/concept/conbody/section/ol/li/table/tgroup/tbody/row/entry {"col2"})Click the Start button to run a Performance Snapshot on the application. The analysis result is collected remotely and copied to the host when collection completes. An analysis-specific viewpoint opens to display the results.
(entry]View and analyze the results on the host system.