A newer version of this document is available. Customers should click here to go to the newest version.
Visible to Intel only — GUID: GUID-B78A8FDA-DD7C-4841-8E9B-0034C206B947
Visible to Intel only — GUID: GUID-B78A8FDA-DD7C-4841-8E9B-0034C206B947
System Overview Analysis
Use a platform-wide System Overview analysis to monitor a general behavior of your target system and identify platform-level factors that limit performance.
The System Overview analysis supports the following profiling modes:
Hardware Event-Based Sampling serves as an entry-point analysis to identify how effectively your code utilizes CPU, GPU, DRAM, I/O, and PCIe.
Hardware Tracing (Linux* and Android* targets) analyzes your code at the microsecond level and helps identify a cause of latency issues.
You can also use the System Overview analysis to get power usage data for your system, with a breakdown of power usage by socket and DRAM module.
Hardware Event-Based Sampling Mode
In this mode, you can capture overall CPU, GPU, and I/O resources utilization and see recommendations for next steps. Use this mode as an entry-level analysis to triage system performance issues.
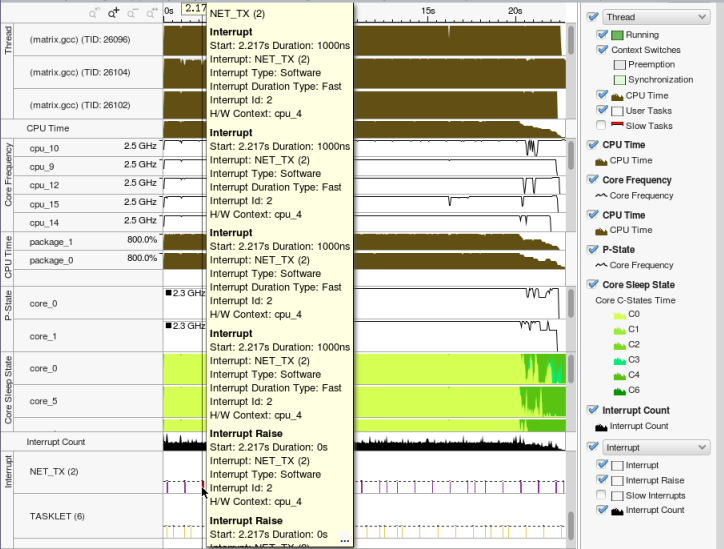
For Linux targets, the System Overview analysis collects the following Ftrace* events: sched, freq, idle, workq, irq, softirq.
For Android targets, the System Overview analysis collects the following events:
Atrace* events: input, view, webview, audio, video, camera, hal, res, dalvik
Ftrace events: sched, freq, idle, workq, filesystem, irq, softirq, sync, disk
Hardware Tracing Mode (Linux and Android Targets)
Use this mode to capture CPU core activities at the microsecond level and detect unusual behavior.
Prerequisites:
To enable system-level analysis for this mode, consider setting the /proc/sys/kernel/perf_event_paranoid value to 0 or less.
To see the kernel module and its symbols, set /proc/sys/kernel/kptr_restrict to 0.
Make sure there is a disk space on both target and host systems. Depending on the number of CPU cores, the amount of collected data may reach 1GB per second.
Make sure your kernel version is 4.3 or higher.
This mode is available for platforms based on Intel® microarchitectures code named Skylake and newer.
In the hardware tracing mode, you can do the following:
Analyze user/kernel mode transitions and interrupts
Explore execution of unexpected processes or system services
Measure particular stages of workload execution without static instrumentation
Analyze CPU core activities at the microsecond level
Analyze a kernel/driver or application module by measuring exact CPU time with a nanosecond precision
Triage latency issues resulted from:
changes in the execution code flow
preemption by another process
resource sharing issues
page faults
power consumption issues caused by unexpected wake-ups
This analysis requires a direct access to the hardware. It does not work inside a Guest VM.
In most cases, the collection overhead in this mode is less than 10%. It can be higher if your application is IO or DRAM bound.
The Hardware Tracing mode does not require sampling drivers.
Configure and Run Analysis
To configure options for the System Overview analysis:
Prerequisites: Create a project.
Click the
 Configure Analysis button on Intel® VTune™ Profiler toolbar.
 The Configure Analysis window opens.
From HOW pane, click the
 Browse button and select System Overview.
 Select Hardware Tracing or Hardware Event-Based Sampling mode.
For the Hardware Tracing mode, you can also enable the Analyze interrupts option.
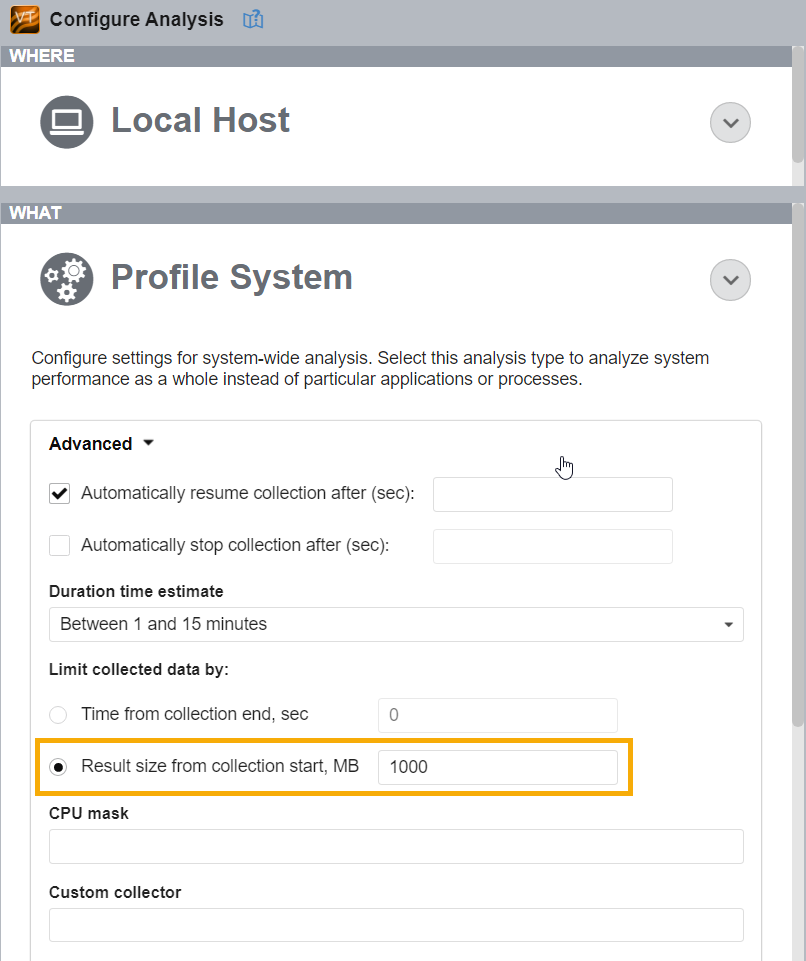
With the default Hardware Tracing configuration, Intel® VTune™ Profiler stops the data collection when a 1GB data limit is reached. You can change this limit in the Advanced section of the WHAT pane:
- In the HOW pane, check options if you are interested in examining power usage or understanding reasons for throttling behavior.
Click the
 Start button to run the analysis.
VTune Profiler collects the data, generates a rxxxso result, and opens it in the default System Overview viewpoint.
To run this analysis from the command line, use the  Command Line button at the bottom.
Power Usage Analysis
Use the power consumption analysis capabilities of the System Overview analysis to get energy consumption characterization for your system.
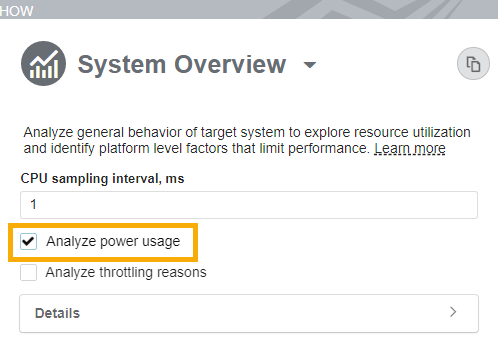
To collect power usage data, check the Analyze power usage checkbox in the HOW pane of the Configure Analysis window. Then run the analysis.
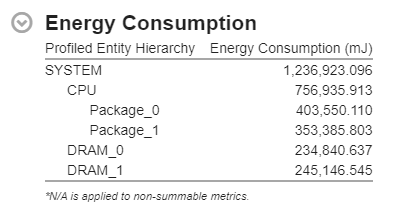
Once the data collection is finished, see the Energy Consumption section of the Summary window.
This section shows the total power consumed by the system during data collection, as well as the breakdown by CPU package and DRAM module.
Switch to the Platform window to get a detailed view of power consumption over time. You can correlate different metrics, such as DRAM bandwidth, CPU frequency, and CPU utilization, with the amount of power consumed by each device.
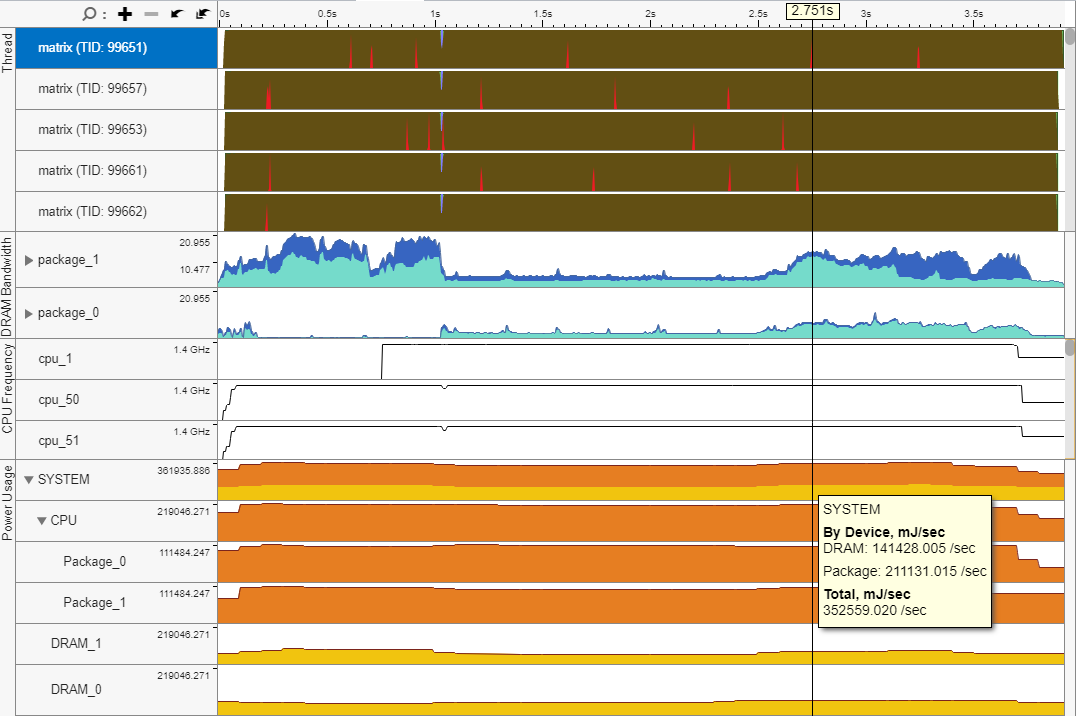
On the timeline, device power is represented in millijoules per second, which is physically equivalent to milliwatts.
Throttling Analysis
If your CPU is operating at temperatures outside safe thermal limits, you may observe a significant drop in CPU frequency as the system attempts to stabilize. The drop in frequency to restore safe CPU operating temperature can result in significant performance loss. Run the System Overview analysis to analyze factors that can cause the CPU to throttle in this way.
In the HOW pane of the Configure Analysis window, check the Analyze throttling reasons checkbox. Then run the analysis.
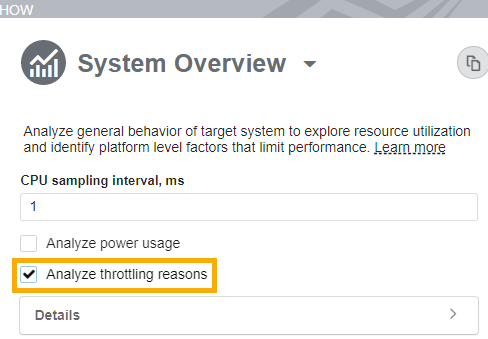
Once the data collection is finished, see the CPU Throttling Reasons section in the Summary window.

Switch to the Platform window to see a breakdown of throttling events according to the reasons causing them.
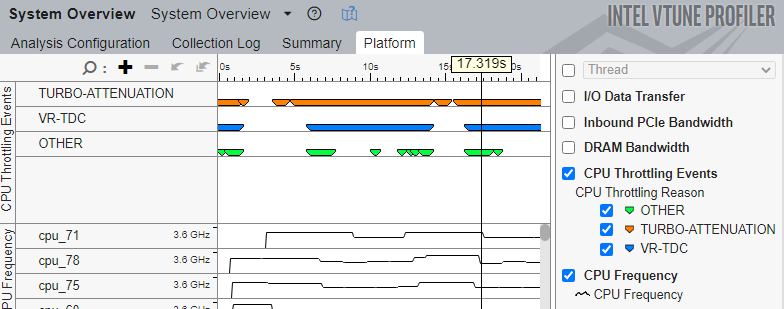
Use this information to understand throttling behavior and make necessary changes to your system configuration. In this table, frequency refers to the processor core frequency.
| Reason | Description |
|---|---|
PROCHOT |
Frequency has dropped below the OS frequency due to assertion of external PROCHOT. |
THERMAL |
Frequency has dropped below the OS frequency due to a thermal event. |
RSR-LIMIT |
Frequency has dropped below the OS frequency due to a Residency State Regulation Limit violation. |
RATL |
Frequency has dropped below the OS frequency due to a Running Average Thermal Limit violation. |
OTHER |
Frequency has dropped below the OS frequency due to electrical or other constraints. |
PBM-PL1 |
Frequency has dropped below the OS frequency due to package/platform-level power limiting PL1. |
PBM-PL2 |
Frequency has dropped below the OS frequency due to package/platform-level power limiting PL2/PL3. |
MAX-TURBO-LIMIT |
Frequency has dropped below the OS frequency due to multi-core turbo limits. |
TURBO-ATTENUATION |
Frequency has dropped below the OS frequency due to turbo transition attenuation. This can cause performance degradation due to frequent changes in operating ratio. |
For more information about these reasons, see the Intel®64 and IA-32 Architectures Software Development Manual.