Visible to Intel only — GUID: GUID-6C42BEEE-E2DD-4E92-A18A-BC76F64F3038
Visible to Intel only — GUID: GUID-6C42BEEE-E2DD-4E92-A18A-BC76F64F3038
Microsoft Visual Studio* Integration
You can simplify the process of debugging code and tuning your application when both your application and tuning tools are available in the same interface. Intel® VTune™ Profiler integrates into Microsoft Visual Studio* environment and enables you to create and tune your application within a single environment.
Explore details on:
Integrate VTune Profiler into Visual Studio during installation
Integrate VTune Profiler into Visual Studio after installation
Integrate VTune Profiler into Visual Studio During Installation
VTune Profiler integrates into Visual Studio by default. You specify the version of Visual Studio used for integration in the IDE Integration portion of the installation wizard. If you have several versions of Visual Studio and want to instruct the installation wizard to use a specific version for integration, click the Customize link and specify the required version. For example:

You can only integrate one version of VTune Profiler into Visual Studio IDE.
Integrate VTune Profiler into Visual Studio After Installation
If you have already installed VTune Profiler and need to integrate it into Visual Studio IDE, do the following:
Open the installation wizard from Control Panel > Programs > Uninstall a program > Intel® VTune™ Profiler > Change.
In the Installed Products window, select the Modify > Add/Remove Components option from the drop-down menu.
Click through to step 3: Integrate IDE. Select the required version of Visual Studio IDE.
Click the Next arrow button to complete the update.
Open VTune Profiler in Visual Studio IDE
Once you have integrated VTune Profiler in Visual Studio, open the IDE. The toolbar displays icons to start VTune Profiler and profile with it.

You can also access VTune Profiler from the Tools menu in the IDE.
Load a project in the Solution Explorer window. Once you have compiled it, you can profile with VTune Profiler. When you click the Open VTune Profiler icon from the toolbar, the application opens to the Welcome Page.
The graphical interface of VTune Profiler integrated into Visual Studio is similar to the standalone VTune Profiler interface.
Configure VTune Profiler for Visual Studio
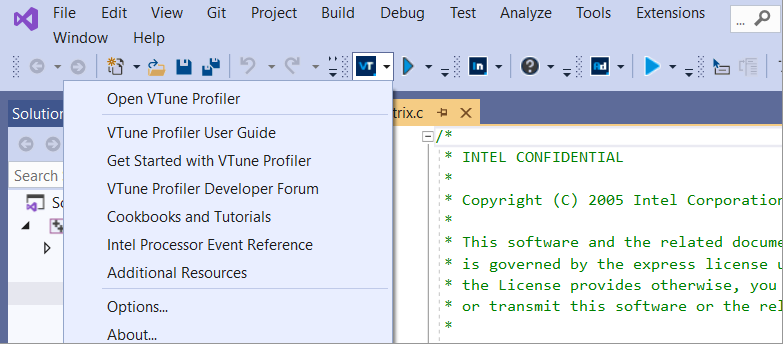
To configure VTune Profiler options in the Visual Studio IDE, click the pull-down menu next to the Open VTune Profiler icon ( ) and select Options...:
Use the General pane to configure general collection options such as application output destination, management of the collected raw data, and so on.
Use the Result Location pane to specify the result name template that defines the name of the result file and its directory.
Use the Source/Assembly pane to manage the source file cache and specify syntax for the disassembled code.
Use the Privacy pane to opt in/out of collecting your information for the Intel® Software Improvement Program.
If you need to change environment settings, however, read the documentation provided for the Visual Studio product.
From the standalone interface, you can access VTune Profiler options via the File > Options... menu.
Supported Visual Studio Projects
VTune Profiler supports the following Visual Studio project types:
public const string FortranProjectType = "{60B2DF28-7A97-4DB5-AD4A-C0A6CFA6A9EC}";
public const string CSProjectType = "{FAE04EC0-301F-11D3-BF4B-00C04F79EFBC}";
public const string VBProjectType = "{F184B08F-C81C-45F6-A57F-5ABD9991F28F}";
public const string ExeProjectType = "{911E67C6-3D85-4FCE-B560-20A9C3E3FF48}";
public const string CPPProjectType = "{8BC9CEB8-8B4A-11D0-8D11-00A0C91BC942}";
public const string ICPPProjectType = "{EAF909A5-FA59-4C3D-9431-0FCC20D5BCF9}";
public const string PythonProjectType = "{888888A0-9F3D-457C-B088-3A5042F75D52}";
public const string FSProjectType = "{F2A71F9B-5D33-465A-A702-920D77279786}";