Visible to Intel only — GUID: GUID-ECB96402-717C-4DAA-B127-85972AF4CB4F
Visible to Intel only — GUID: GUID-ECB96402-717C-4DAA-B127-85972AF4CB4F
Intel Processor Events Reference
Intel® VTune™ Profiler provides a set of hardware event-based analysis types that help you estimate how effectively your application uses hardware resources. These analysis types monitor hardware events supported by your system's Performance Monitoring Unit (PMU). The PMU is hardware built inside a processor to measure its performance parameters such as instruction cycles, cache hits, cache misses, branch misses and many others.
For more information on Intel® 64 and IA-32 architectures, explore Intel Software Developer Manuals available at https://www.intel.com/content/www/us/en/developer/articles/technical/intel-sdm.html.
For details on hardware events supported by your system's PMU, use any of the following options:
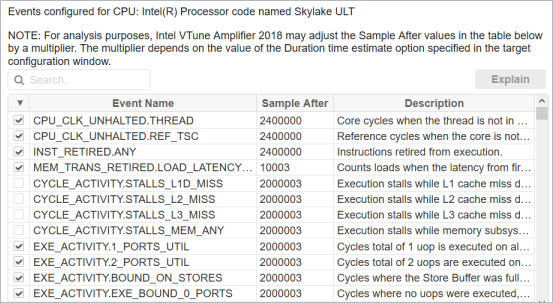
When adding new events to your custom configuration, select an event in the table and explore its short description, or click the Explain button to open the Intel Processor Events Reference for more details:

For a full list of processor events and descriptions, explore the web-based Intel Processor Events Reference.