Visible to Intel only — GUID: GUID-731837A7-DE6E-4F31-88D2-139C524DD8DF
Visible to Intel only — GUID: GUID-731837A7-DE6E-4F31-88D2-139C524DD8DF
Embedded Linux* Targets
Use the Intel® VTune™ Profiler for performance analysis on Embedded Linux* systems, Wind River*, Yocto Project*, FreeBSD* and others.
Embedded device performance data can be collected remotely on the embedded device and running the analysis from an instance of VTune Profiler installed on the host system. This is useful when the target system is not capable of local data analysis (low performance, limited disk space, or lack of user interface control).
Root access to the operating system kernel is required to install the collectors and drivers required for performance analysis using VTune Profiler.
To enable performance analysis on an embedded device, use any of the following:
- Intel System Studio integration layer (Wind River* Linux and Yocto Project* only)
- Intel VTune Profiler Yocto Project Integration Layer
- bundled VTune Profiler installation packages
Use the Intel System Studio Integration Layer
The Intel System Studio integration layer works for embedded systems with Wind River Linux or Yocto Project installed.
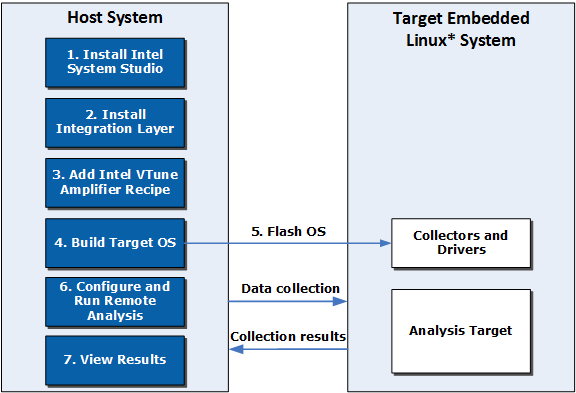
The Intel System Studio integration layer allows the Intel System Studio products to be fully integrated with a target operating system by building the drivers and corresponding target packages into the operating system image automatically. Use this option in the case where a platform build engineer has control over the kernel sources and signature files, but the application engineer does not. The platform build engineer can integrate the product drivers with the target package and include them in the embedded device image that is delivered to the application engineer.

Install Intel System Studio using the installer GUI.
Install the Intel System Studio integration layer.
- Copy the integration layer from the Intel System Studio installation folder to the target operating system development folder.
Run the post-installation script: <iss-install-dir>/YoctoProject/meta-intel-iss/yp-setup/postinst_<OS>_iss.sh <ISS_BASE_dir>
For example, for Wind River Linux: /YoctoProject/meta-intel-iss/yp-setup/postinst_wr_iss.sh
Build the recipe that includes the appropriate VTune Profiler package.
Add the path to the /YoctoProject/meta-intel-iss to the bblayers.conf file:
BBLAYERS= "\
...
<OS_INSTALL_DIR>/YoctoProject/meta-intel-iss\
...
"
Add the VTune Profiler recipes to conf/local.conf. Possible recipes include:
intel-vtune-drivers: integrates all VTune Profiler drivers for PMU-based analysis with stacks and context switches. Requires additional kernel options to be enabled.
intel-vtune-sep-driver: integrates drivers for PMU-based analysis with minimal requirements for kernel options.
For more information about these collection methods, see Remote Linux Target Setup.
Build the target operating system, which will complete the integration of the VTune Profiler collectors and drivers.
Flash the operating system to the target embedded device.
After flashing the operating system to the target embedded device, ensure that the appropriate VTune Profiler drivers are present. For more information, see Building the Sampling Drivers for Linux Targets.
Run the analysis on the target embedded device from the host system using an SSH connection or using the SEP commands.
Set up a password-less SSH access to the target using RSA keys.
Specify your target application and remote system.
NOTE:After configuring the remote connection, VTune Profiler will install the appropriate collectors on the target system.
Choose an analysis type.
Run the analysis from the host.
Use the information available in the Sampling Enabling Product User's Guide to run the SEP commands.
View results in the VTune Profiler GUI on the host.
Examples: Configuring Yocto Project* with the Intel System Studio Integration Layer
Use the Intel VTune Profiler Yocto Project Integration Layer
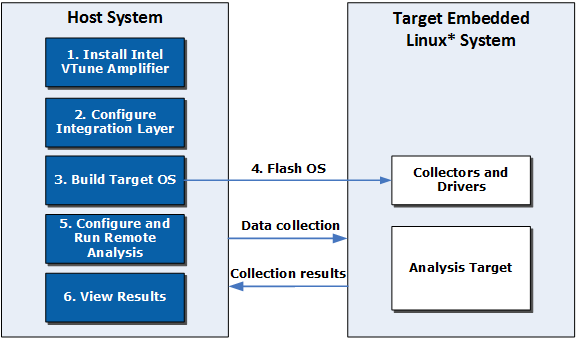
Intel VTune Profiler Yocto Project integration layer builds the drivers into the operating system image automatically. Use this option in the case where a platform build engineer has control over the kernel sources and signature files, but the application engineer does not. The platform build engineer can integrate the product drivers with the target package and include them in the embedded device image that is delivered to the application engineer.

Install Intel VTune Profiler.
Configure the integration layer.
Extract the <install-dir>/target/linux/vtune_profiler_target_x86.tgz or <install-dir>/target/linux/vtune_profiler_target_x86_64.tgz package.
Modify the sepdk/vtune-layer/conf/user.conf file to specify user settings.
Specify one of the following paths:
Path to unzipped target package: VTUNE_TARGET_PACKAGE_DIR = "<PATH>"
Path to VTune Profiler installation directory: VTUNE_PROFILER_2020_DIR = "<PATH>"
(Optional) To integrate the SEP driver during system book, specify ADD_TO_INITD = "y".
Copy the integration layer to the Yocto Project development environment.
Add the path to the layer to the bblayers.conf file:
BBLAYERS= "\
...
<OS_INSTALL_DIR>/vtune-layer\
...
"
Add the VTune Profiler recipes to conf/local.conf. Possible recipes include:
intel-vtune-drivers: integrates all VTune Profiler drivers for PMU-based analysis with stacks and context switches. Requires additional kernel options to be enabled.
intel-vtune-sep-driver: integrates drivers for PMU-based analysis with minimal requirements for kernel options.
For more information about these collection methods, see Remote Linux Target Setup.
Build the target operating system, which will complete the integration of the VTune Profiler collectors and drivers.
Flash the operating system to the target embedded device.
After flashing the operating system to the target embedded device, ensure that the appropriate VTune Profiler drivers are present.
5. Run the analysis on the target embedded device from the host system using an SSH connection or using the SEP commands.
Set up a password-less SSH access to the target using RSA keys.
Specify your target application and remote system.
Choose an analysis type.
Run the analysis from the host.
Use the information available in the Sampling Enabling Product User's Guide to run the SEP commands.
View results in the VTune Profiler GUI.
Example: Configuring Yocto Project with the VTune Profiler Integration Layer
Use the Bundled Intel VTune Profiler Installation Packages
You can build the appropriate drivers and install the VTune Profiler collectors on your kernel image manually with a command line. This option requires root access to the configured kernel source.

Install Intel VTune Profiler using the installer GUI.
Run the analysis on the target embedded device.
Set up a password-less SSH access for the root user to the target using RSA keys.
Specify your target application and remote system. The collectors and drivers within the package should be automatically installed.
Choose an analysis type.
Run the analysis from the host.
3. View results in the VTune Profiler GUI on the host.
Troubleshooting
If the drivers were not built during collector installation, the installation output should inform you that building the sampling driver is required.
The drivers are built either on the target system or on the host system, depending on compiler toolchain availability:
If the compiler toolchain is available on the target system:
- On the target embedded device, build the driver from the <install-dir>/sepdk/src directory using the ./build-driver command.
- Load the driver into the kernel using the ./insmod-sep command.
If the compiler toolchain is not available on the target system:
- On the host system, cross-build the driver using the driver source from the target package sepdk/src directory with the ./build-driver command. Provide the cross-compiler (if necessary) and the target kernel source tree for the build.
- Copy the sepdk/src folder to the target system.
- Load the driver into the kernel using the ./insmod-sep command.
Example: Configuring Yocto Project with Intel VTune Profiler Target Packages