A newer version of this document is available. Customers should click here to go to the newest version.
FreeBSD* Targets
Intel® VTune™ Profiler allows you to collect performance data on a FreeBSD* target system.
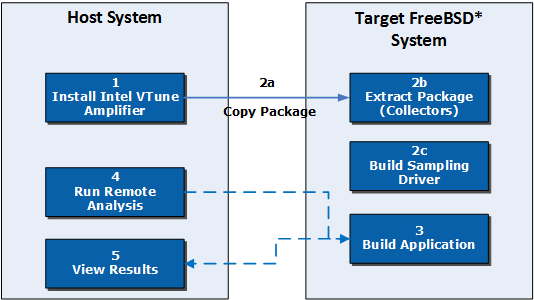
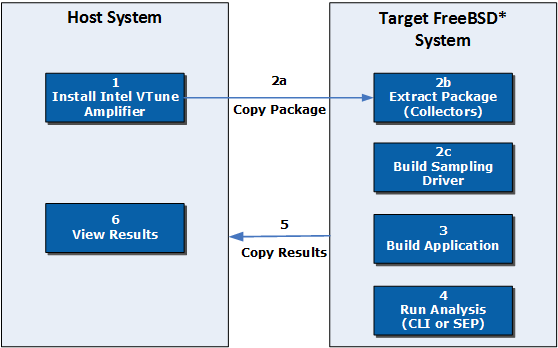
Intel VTune Profiler is not installed on the FreeBSD target system. Instead, you are able to install VTune Profiler on a Linux*, Windows*, or macOS* host system and use a target package for collecting event-based sampling data on a remote FreeBSD target system in one of the following ways:
Using VTune Profiler's automated remote collection capability (command line or user interface)
Collecting the results locally on the FreeBSD system and copying them to the host system for viewing with VTune Profiler (command line only)
The following sections explain these options in more detail.
Supported Features
Remote Collection |
Local Collection |
|---|---|
Collection from Linux, Windows, or macOS host system using the Intel VTune Profiler GUI or command line (vtune) |
Collection from the FreeBSD system using:
|
Analysis Types:
|
Analysis types (VTune Profiler command line only):
|
View results on host system |
View results in VTune Profiler on a Linux, Windows, or macOS host system |
Remote Collection from Host System

Install VTune Profiler on your Linux*, Windows*, or macOS* host. Refer to the Installation Guide for your host system for detailed instructions.
Install the appropriate sampling drivers on the FreeBSD target system. For more information, see FreeBSD* System Setup.
[Optional] If you want to collect performance data with stacks, build your FreeBSD target application using the -fno-omit-frame-pointer compiler option, to allow the sampling collector to determine the call chain via frame pointer analysis.
Collect performance data using remote analysis from the host system from the VTune Profiler command line or GUI.
Create or open a project.
Specify your target application and remote system and make sure to specify search directories for symbol/source files required for finalization on the host.
Choose and configure an analysis type.
Supported VTune Profiler analysis types (event-based sampling analysis only) include:
- Hotspots (hardware event-based sampling mode)
- Microarchitecture Exploration
- Memory Access (without heap object allocation tracking)
- Input and Output (with hardware event-based metrics and SPDK analysis; without MMIO accesses and DPDK analysis)
- Custom Analysis
Run the analysis from the host. Depending on your settings, the application launches and runs automatically. Once collection is finished, the result is finalized and displayed with the Summary window open.
Review the results on the host system.
Native Collection on FreeBSD System

Install VTune Profiler on your Linux*, Windows*, or macOS* host. Refer to the Installation Guide for your host system for detailed instructions.
Install the appropriate sampling drivers on the FreeBSD target system. For more information, see FreeBSD* System Setup.
[Optional] If you want to collect performance data with stacks, build your FreeBSD target application using the -fno-omit-frame-pointer compiler option, which allows the sampling collector to determine the call chain via frame pointer analysis.
Collect performance data using one of the following methods. For more information about each of these methods, see Remote Linux Target Setup.
Native analysis on the target system using the VTune Profiler command line (vtune). Supported analysis types include: hotspots, uarch-exploration, memory-access, io or custom event-based sampling analysis.
Native analysis on the target system using the sampling enabling product (SEP) collectors. For more information, see the Sampling Enabling Product User Guide.
Copy the results to the host system.
Review the results with VTune Profiler.
If you used the vtune command, open the *.vtune file.
If you collected SEP data, import the *.tb7 file.