A newer version of this document is available. Customers should click here to go to the newest version.
Window: SC Device States - Platform Power Analysis
To access this window: Select the Platform Power Analysis viewpoint and click the SC Device States sub-tab in the result tab.
Use the SC Device States window to:
- Identify the time spent in D0ix states by each device.
- Analyze the trend of D0ix state residency over time.
- Review the percent of time a device spent in a particular D0ix state.
The South Complex contains low-intensity computing sub-systems, such as I/O and system management components. D0ix states are low-power states used on system on a chip (SoC) platforms. The South Complex devices are represented using logical sub-system (LSS) identifiers specific to the platform on which the collection was run.
Platform Power Analysis viewpoint is available as part of energy analysis. Collecting energy analysis with Intel® SoC Watch is available for target Android*, Windows*, or Linux* devices. Import and viewing of the Intel SoC Watch results is supported with any version of the VTune Profiler.
South Complex Device Pane

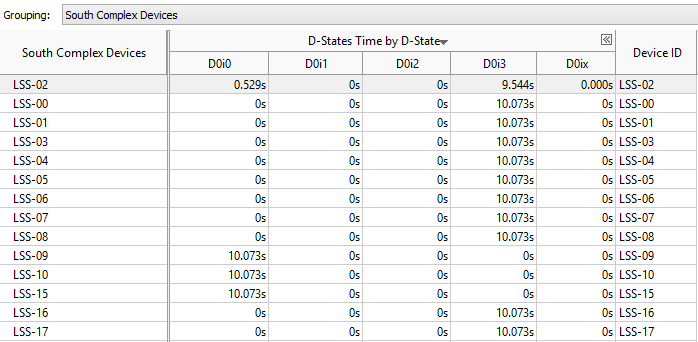
The South Complex Device States pane shows the list of devices in the South Complex and displays estimated sample counts for each device. The sample counts are not a precise measure of the length of time each device spent in a state, but can be used as a guideline to determine if a device spent a greater amount of time in a particular state than was expected.
Click the expand![]() /collapse
/collapse![]() buttons in the data columns to expand the column and show data for different D-States in each device. You can change the unit displayed by right-clicking a data cell and selecting the Show Data As option to select an alternate unit. For example, you could select Show Data As > Percent to view the percent of collection time a particular device spent in the active state.
buttons in the data columns to expand the column and show data for different D-States in each device. You can change the unit displayed by right-clicking a data cell and selecting the Show Data As option to select an alternate unit. For example, you could select Show Data As > Percent to view the percent of collection time a particular device spent in the active state.
Timeline Pane
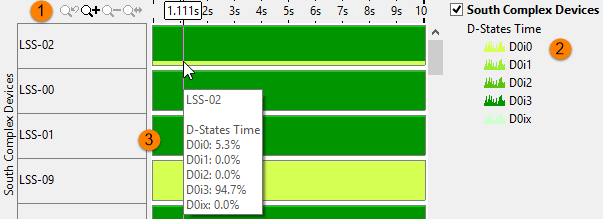
The Timeline pane displays the D0ix states of each device, at each point in time. You can rearrange the order of the devices in the timeline by dragging and dropping.

 |
Toolbar | Navigation control to zoom in/out on the view on areas of interest. For more details on the Timeline control, see Managing Timeline View. |
 |
Legend | Types of data presented on the timeline. Filter in/out any type of data presented on the timeline by selecting/deselecting corresponding check boxes. |
 |
South Complex Devices | Graphical representation of the time spent in a D-State. Each state is a different color, which can be filtered using the legend. Hover over the timeline for a device to view the total percentage of time spent in a particular state. Zoom in or out on the timeline to view trends in more detail. Filters applied on a timeline in one window are applied on all other windows within the viewpoint. This is useful if you identify an issue on one tab and want to see how the issue impacts the metrics shown on a different tab. |