A newer version of this document is available. Customers should click here to go to the newest version.
Visible to Intel only — GUID: GUID-0BBB2874-94F4-4168-8BDE-FDA981E89F0E
Visible to Intel only — GUID: GUID-0BBB2874-94F4-4168-8BDE-FDA981E89F0E
Task Analysis
Focus your performance analysis on a task - program functionality performed by a particular code section.
Use the Intel® VTune™ Profiler to analyze the following types of tasks:
ITT API tasks: Analyze performance of particular code regions (tasks) if your target uses the Task API to mark task regions and you enabled the Analyze user tasks, events and counters option during the analysis type configuration
Platform tasks: Analyze tasks enabled for analysis of Ftrace* events, Atrace* events, Intel Media SDK programs, OpenCL™ kernels, and so on.
Enabling Task Analysis
Prerequisites:
- Use the ITT Task API to insert calls in your code and define the tasks.
- Configure your analysis target.
Click the
 (standalone GUI)/
  (Visual Studio IDE) Configure Analysis button on the VTune Profiler toolbar.
 Choose the analysis type from the HOW pane.
Select the Analyze user tasks, events, and counters option.
Click the Start button to run the analysis.
VTune Profiler collects data detecting the marked tasks.
Analyze the collected results to identify the task regions and task duration versus application performance over time.
To interpret the data provided during the user task analysis, you may use the following options:
Identify Most Critical Tasks
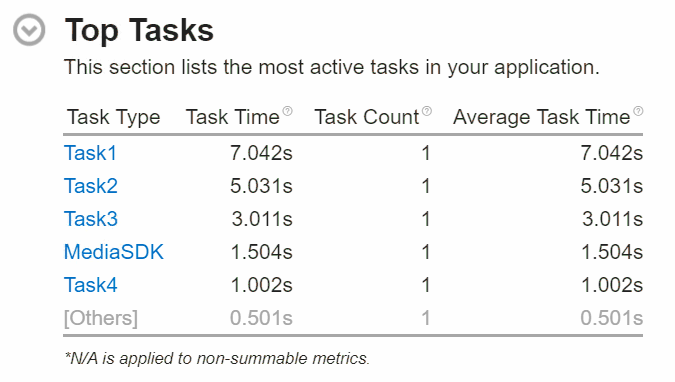
Start exploring the collected data with the Summary window where the Top Tasks section provides a list of tasks that took most of the time to execute.

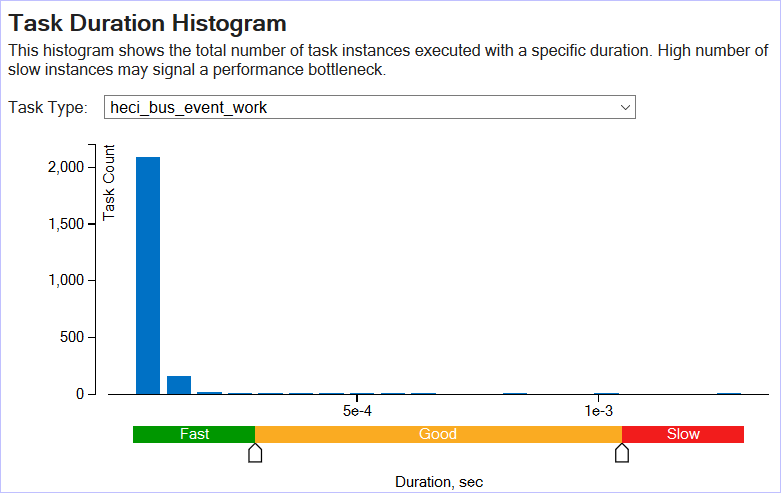
If you collected data for Ftrace/Atrace tasks using the System Overview or a custom analysis with Ftrace/Atrace events selected, the Summary window also provides the Task Duration Histogram that helps you identify slow tasks:

Use the Task Type drop-down list to switch between different tasks and analyze their duration. Based on the thresholds set up for the task duration, you can understand whether the duration of the selected task is acceptable or slow.
Analyze Slow Tasks per Function
Click a task type in the Top Tasks section to switch to the grid view (for example, Bottom-up or Event Count) grouped by the Task Type granularity. The task selected in the Summary window is highlighted. For example, for ITT API tasks collected during the Threading analysis the Bottom-up grid view is grouped by Task Type/Function/Call Stack:

In the example above, the func4_task task has the longest duration - 2.923 seconds. You may expand the node to see the function this task belongs to. Double-click the function to analyze the source code in the Source view.
For Ftrace/Atrace tasks collected during the System Overview analysis, you may select the Task Type/Task Duration Type/Function/Call Stack granularity and explore functions executed while a slow task instance was running. You may double-click the function to open its source code and analyze the most time-consuming source lines.

Analyze Tasks per Threads
To analyze a duration of each task instance, explore the Timeline view:

User tasks are shown on the timeline with yellow markers. Hover over a task marker for task execution details. In the example above, the func2_task started at the 3.4th second of the application execution on the thread threadstartex (TID: 8684) and lasted for 3.002 seconds.
If you collected platform-wide metrics, you may switch to the Platform window and identify threads responsible for particular tasks. Each task shows up in the Thread section as a separate layer.

For Ftrace/Atrace tasks, the Platform view provides an option to enable Slow Tasks markers and explore the CPU utilization, GPU usage and power consumption at the moment of slow tasks execution:

If several tasks were executed on a thread in parallel, a stack of tasks is displayed.