A newer version of this document is available. Customers should click here to go to the newest version.
Visible to Intel only — GUID: GUID-08C0D0A7-D91A-4006-9D4D-D4A2041CF0C0
Visible to Intel only — GUID: GUID-08C0D0A7-D91A-4006-9D4D-D4A2041CF0C0
Source Code Analysis
For better understanding of a performance problem, associate a hotspot with the source code and exact machine instruction(s) that caused this hotspot.
Prerequisites
Intel® VTune™ Profiler provides accurate source analysis if your code is compiled with the debug information and debug information is written correctly in the binary file (for Linux* targets) or debug information file/symbol file (for Windows* targets).
Access Source View
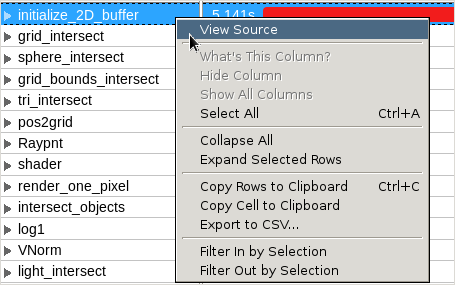
To open the source/assembly code of a specific item, either double-click the selected item in the grid view/Call Stack/Timeline pane, or select the View Source option from the context menu:

Depending on the route you used to access the Source view, the data representation on the panes may slightly differ:
If you access the Source view by clicking a function in the grid, the VTune Profiler opens the source at the hottest (with the highest value of the metric selected for hotspot navigation) line of this function in the Source/Assembly pane.
When you click a call stack function, the VTune Profiler opens the source highlighting the call site (location where a function call is made) at the top of the call stack. The call site is marked with the yellow arrow
 .
. If you click a wait in the Timeline pane, the VTune Profiler opens a wait function highlighting the waiting call site. If you double-click a transition (for Threading data), it highlights the signaling call site.
Analyze Code
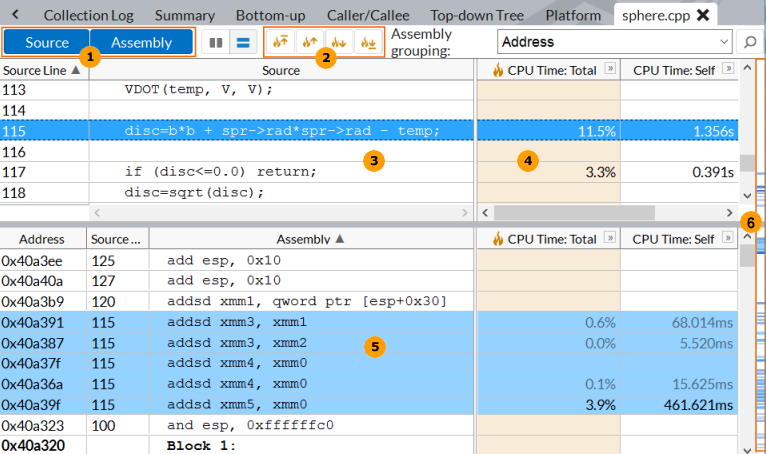
The Source/Assembly window opens in a separate tab:

 |
Source/Assembly toggle buttons. By default, depending on the symbol information availability, the VTune Profiler opens one of the panes: Source or Assembly. But you can use the toggle Source and Assembly buttons on the toolbar to manage the view and enable both of them if required/possible. The content displayed on the Source and Assembly panes is correlated. When you select an element on one pane, another pane scrolls to the corresponding elements and highlights them.
NOTE:
|
 |
Hotspot navigation buttons. Typically, the VTune Profiler opens the source code highlighting the most performance critical code line based on the key metric set up for this analysis. To go further and freely navigate between code lines that have the highest metric value (hotspots), use these buttons toolbar:
|
 |
The Source pane shows your code written on a high-level programming language, for example, C, C++, or Fortran. The Source pane opens if the symbol information for the selected function is available. |
 |
Hotspot navigation metric column. By default, the source view navigation is based on the key analysis metric like the CPU Time for the Hotspots analysis. Such a metric column is highlighted. To change the hotspot navigation metric, right-click the required column and select Use for Hotspot Navigation command from the context menu. |
 |
The Assembly pane displays disassembled code. This code shows the exact order of the assembly instructions executed by the processor. Instructions on the Assembly pane are grouped into basic blocks. To get help on a particular instruction, select it in the grid, right-click and choose Instruction Reference from the context menu. For better navigation in the Assembly pane, you may select one of the available granularity levels in the Assembly grouping drop-down menu: Address, Basic Block/Address, or Function Range/Basic Block/Address. VTune Profiler updates the Assembly view grouping the instructions into collapsible nodes according to the selected hierarchy. If there is no correct debug information, or symbol file is unavailable, the assembly data may be incorrect. In this case, the VTune Profiler uses heuristics to define function boundaries in the binary module. |
 |
Heat map markers. Use the blue markers to the right of the vertical scroll bar to quickly identify the hotspot lines (based on the hotspot navigation metric). To view a hotspot, move the scroll bar slider to the marker. The bright blue marker ( |
Edit Source
When tuning your target, you may need to modify the source code. VTune Profiler enables you to open the source files for editing directly from the Source/Assembly window.
To launch the source editor:
In the Source pane, select a line you want to edit.
Right-click the line and select Edit Source from the context menu, or click the Open Source File Editor
 button on the Source/Assembly toolbar.
 Your source code opens in the code editor set in your system as default. For example, on Linux the code editor is defined in the EDITOR environment variable (for example, vi) or VISUAL environment variables (for example, gedit, emacs). Depending on the editor application, the code may open exactly on the selected line.
After editing your code, rebuild your target and re-run the VTune Profiler analysis on the modified version to compare the performance results before and after optimization.
The Source/Assembly analysis is not supported for the source code using the #line directive.
 - Go to the code line that has the maximal metric value.
  - Go to the previous (by metric value) hotspot line.
  - Go to the next (by metric value) hotspot line.
  - Go to the code line that has the minimal metric value.
  ) indicate hot lines for other functions.