A newer version of this document is available. Customers should click here to go to the newest version.
Visible to Intel only — GUID: GUID-7D515CF2-E6B8-404E-9E1A-6B710BBBB2F1
Visible to Intel only — GUID: GUID-7D515CF2-E6B8-404E-9E1A-6B710BBBB2F1
Set Up Linux* System for Remote Analysis
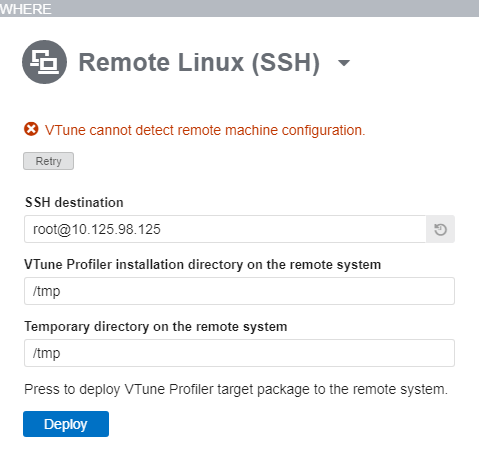
You can collect data remotely on a target Linux* system by specifying the system as the analysis target in Intel® VTune™ Profiler by selecting Remote Linux (SSH) in the Where pane when configuring an analysis. VTune Profiler provides an option to automatically install the appropriate collectors on the target system. Specify a location for the install using the VTune Profiler installation directory on the remote system field.
The automatic installation on the remote Linux system does not build the sampling drivers although you can install the pre-built sampling drivers if you connect via password-less SSH as the root user. Driverless sampling data collection is based on the Linux Perf* tool functionality, which is available without Root access and has a limited scope of analysis options. To collect advanced hardware event-based sampling data, manually install the sampling driver or set up the password-less SSH connection with the Root user account.
Install the VTune Profiler collectors on the target system.
If the collectors are not automatically installed or you get an error message after an automatic install attempt, use the following steps to manually prepare for data collection on a remote Linux system:
Build and install sampling drivers. (Optional).
Install the VTune Profiler Collectors Automatically
When you enter the connection parameters in the Remote Linux* (SSH) window of the WHERE pane, VTune Profiler checks for the presence of VTune Profiler collector package on the target system specified.
If an appropriate package was not located on the target system, VTune Profiler offers to deploy the package automatically.

Press the Deploy button to start the automatic collectors package deployment process.
If the collectors are not automatically installed or you get an error message after an automatic install attempt, you can install the collectors manually.
Install the VTune Profiler Collectors Manually
Use the following steps to set up analysis on a target regular or embedded Linux target system.
Copy the required target package archive to the target device using ftp, sftp, or scp. The following target packages are available on the host system where the VTune Profiler is installed:
<install-dir>/target/linux/vtune_profiler_target_sep_x86.tgz - provides hardware event-based sampling collector only (SEP) for x86 systems
<install-dir>/target/linux/vtune_profiler_target_sep_x86_64.tgz - provides hardware event-based sampling collector only (SEP) for 64-bit systems
<install-dir>/target/linux/vtune_profiler_target_x86.tgz - provides all VTune Profiler collectors for x86 systems
<install-dir>/target/linux/vtune_profiler_target_x86_64.tgz - provides all VTune Profiler collectors for 64-bit systems
NOTE:Use both *_x86 and *_x86_64 packages if you plan to run and analyze 32-bit processes on 64-bit systems.
On the target device, unpack the product package to the /tmp directory or another writable location on the system:
target> tar -zxvf <target_package>.tgz
VTune Profiler target package is located in the newly created directory /tmp/vtune_profiler_<version>.<package_num>.
When collecting data remotely, the VTune Profiler looks for the collectors on the target device in its default location: /tmp/vtune_profiler_<version>.<package_num>. It also temporary stores performance results on the target system in the /tmp directory. If you installed the target package to a different location or need to specify another temporary directory, make sure to configure your target properties in the Configure Analysis window as follows:
Use the VTune Profiler installation directory on the remote system option to specify the path to the VTune Profiler on the remote system. If default location is used, the path is provided automatically.
Use the Temporary directory on the remote system option to specify a non-default temporary directory.
Alternatively, use the -target-install-dir and -target-tmp-dir options from the vtune command line.
Build and Install the Drivers Manually
Building the sampling drivers is only required if the drivers were not built as part of the collector installation. The installation output should inform you if building the sampling driver is required.
To enable hardware event-based sampling analysis on your target device:
Build the sampling driver on the target system.
NOTE:Make sure kernel headers correspond to the kernel version running on the device. For details, see the README.txt file in the sepdk/src directory.
Make sure compiler version corresponds to the architecture (x86 or x86_64) of the kernel running on the target system.
For Hotspots in hardware event-based sampling mode, Microarchitecture Exploration, and Custom event-based sampling analysis types, you may not need root credentials and installing the sampling driver for systems with kernel 2.6.32 or higher, which exports CPU PMU programming details over /sys/bus/event_source/devices/cpu/format file system. Your operating system limits on the maximum amount of files opened by a process as well as maximum memory mapped to a process address space still apply and may affect profiling capabilities. These capabilities are based on Linux Perf* functionality and all its limitations fully apply to the VTune Profiler as well. For more information, see the Tutorial: Troubleshooting and Tips topic at https://perf.wiki.kernel.org/index.php/Main_Page.
On the target device, install the drivers.
If the insmod-sep script does not work on the target system due to absence of standard Linux commands, you may install drivers manually using the Linux OS insmod command directly.
To build the sampling driver as RPM using build services as Open Build Service (OBS), use the sepdk.spec file located at the <install-dir>/sepdk/src the directory.