A newer version of this document is available. Customers should click here to go to the newest version.
Visible to Intel only — GUID: GUID-8B05A961-8F97-4FFC-A628-15A96C42B507
Visible to Intel only — GUID: GUID-8B05A961-8F97-4FFC-A628-15A96C42B507
Pane: Call Stack
The Call Stack pane is available for these collections:
- User-mode sampling and tracing collection, such as Hotspots and Threading analyses
- GPU Offload analysis
- Hardware event-based sampling with the stack collection enabled
Use the Call Stack pane to identify the call sequences (stacks) that called the program unit selected in the grid. Call stacks from different threads are aggregated together, showing all the call stacks for a function, without providing information on what threads were calling. See the table below to understand how to use the data provided in the Call Stack pane for the Threading analysis results.

|
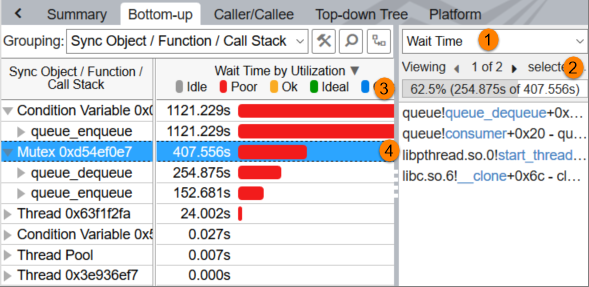
Stack metric drop-down menu. Select a performance metric to explore the distribution of this metric over stacks of the selected object. For example, for the Threading Efficiency viewpoint the Wait Time metric is preselected. For the GPU Offload viewpoint, the Execution metric is preselected. |
|
Navigation bar. Click the next/previous When multiple stacks lead to the selected program unit, the Call Stack pane shows the stack that contributed most to the metric value, the hottest path, as the first stack. To see other stacks, click the navigation arrows.
NOTE:
|
|
Contribution bar. Analyze the indicator of the contribution of the currently visible stack to the overall metric data for the selected program unit(s). If you select a single stack in the result window, the Contribution bar shows 100%. If more than one program unit is selected, all the related stacks are added to the calculation. In the example above, the function selected in the Bottom-up grid had 3 Wait Time stacks leading to it with the total Wait time 23.718 seconds. The first stack is responsible for 97.9% (or 23.230s) of the overall 23.718 seconds. Note that the Bottom-up grid aggregates all 3 stacks into one since all of them go to the same function in different code lines. |
|
Call stack for a program unit selected in the grid or in the Timeline pane. Analyze the call sequence for the selected function according to the stack metric selected in the navigation bar. Each row in the stack represents a function (with an RVA and a line number of the call site, if available) that called the function in the row above it. When the Call Stack Mode on the filter toolbar is set to Only user functions, the system functions are shown at the bottom of the stack. When set to User/system functions, the system functions are shown in the correct location, according to the call sequence. Click a hyperlink or double-click a function in the stack to open the source exactly where this function was called.
NOTE:
If you see [Unknown frame(s)] identifiers in the stack, it means that the VTune Profiler could not locate symbol files for system or your application modules. See the Resolving Unknown Frames topic for more details. |
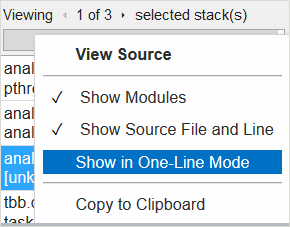
Context menu. Manage the call stack representation in the Call Stack pane (applicable to all stacks). Right-click and select an option. For example, you may de-select the Show in One-Line Mode option to view functions in two lines:
|
When you compare two analysis results, the Call Stack pane does not show any call stacks.

 arrows to view stacks for the selected program unit(s). The