A newer version of this document is available. Customers should click here to go to the newest version.
Visible to Intel only — GUID: GUID-7C94611E-1F1E-4599-8C73-33D6FDA1D70F
Visible to Intel only — GUID: GUID-7C94611E-1F1E-4599-8C73-33D6FDA1D70F
Metrics Distribution Over Call Stacks
 |
When interpreting the performance analysis results, you can select an object in the grid and select a performance metric in the drop-down menu of the Call Stack pane to:
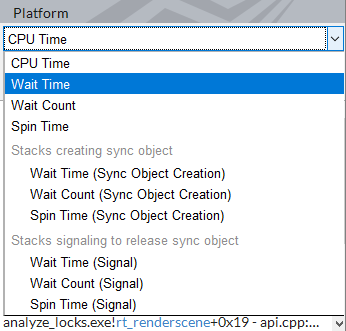
You can also select an object in the Timeline pane. In this case, the Call Stack pane displays metric data for all objects with the same stacks. Depending on your analysis configuration, the following metrics are available: |
Use This Metric |
To Analyze This |
|---|---|
CPU Time |
Time during which the CPU is actively executing your application on all cores. |
Overhead and Spin Time |
Combined Overhead and Spin time calculated as CPU Time where call site type is Overhead + CPU Time where call site type is Synchronization. |
Wait Time |
Distribution of time when one thread is waiting for a signal from another thread. For example, a thread that needs a lock that is currently held by another thread, is waiting for the other thread to release the lock. |
Wait Count |
Distribution of the number of times the corresponding system wait API was called. |
Spin Time |
Distribution of Wait Time during which the CPU was busy. |
Task Time (Task) |
Time spent within a task. |
Context Switch Time |
Distribution of software thread inactive time due to a context switch, regardless of its reason (Preemption or Synchronization), over different call stacks. |
Context Switch Count |
Distribution of the amount of context switches, regardless of their reason (Preemption or Synchronization), over different call stacks. |
Preemption Context Switch Count |
Distribution of the amount of context switches where the operating system task scheduler switched a thread off a processor to run another, higher-priority thread. |
Synchronization Context Switch Count |
Distribution of the amount of context switches where a thread was switched off because of making an explicit call to thread synchronization API or to I/O API. |
Inactive Time |
Distribution of time during which a thread remained preempted from execution. |
Event metric such as Instructions Retired, Clockticks, LLC Miss, and others |
Distribution of a hardware event. Use this metric to identify stacks with the highest contribution of the event count into the total event count collected for the target. |
Wait Time (Signal) |
Distribution of Wait Time by call stacks of a signaling thread that was releasing a lock where the thread was waiting. Use this metric to identify signaling stacks resulted in long waits to optimize algorithms of the signaling thread. |
Wait Count (Signal) |
Distribution of Wait Count by call stacks of a signaling thread that was releasing a lock where the thread was waiting. Use this metric to identify signaling stacks resulted in the high number of waits. |
Spin Time (Signal) |
Distribution of Spin Time by call stacks of a signaling thread that was releasing a lock where the thread was waiting. Use this metric to identify signaling stacks resulted in long waits while the CPU is busy. |
Wait Time (Sync Object Creation) |
Distribution of Wait Time by various object creations. For example, the currently selected row in the grid may contain wait operations on various objects created in different places of the program. |
Wait Count (Sync Object Creation) |
Distribution of Wait Count by various object creations. |
Spin Time (Sync Object Creation) |
Distribution of Spin Time by various object creations. |
Loads (Memory Allocation) |
Distribution of the total number of loads in the stacks allocating memory objects. |
Execution (Computing Task (GPU)) |
Distribution of time spent in the stacks to execute computing tasks. Use this metric to identify most expensive operations for Offload. |
Host-to-Device Transfer (Computing Task (GPU)) |
Distribution of time spent in the stacks to transfer data from host to device. Use this metric to identify most expensive operations for Offload. |
Device-to-Host Transfer (Computing Task (GPU)) |
Distribution of time spent in the stacks to transfer data from device to host. Use this metric to identify most expensive operations for Offload. |
If a selected stack type is not applicable to a selected program unit, VTune Profiler uses the first applicable stack type from the stack type list instead.