Visible to Intel only — GUID: GUID-DE0A1B6D-3406-4B35-8592-EF9127835869
Visible to Intel only — GUID: GUID-DE0A1B6D-3406-4B35-8592-EF9127835869
Minimize Collection Overhead
Explore configuration options provided by the Intel® VTune™ Profiler that incur collection overhead and increase the result size.
If required, consider disabling or modifying these options either by editing the predefined analysis configuration or by creating a new custom analysis type:
Hotspots Sampling Mode
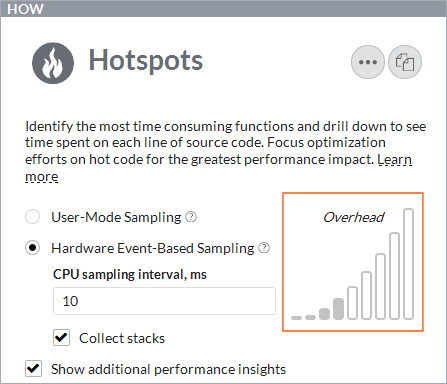
When you select the Hotspots analysis, you can choose between the User-Mode Sampling (higher overhead) and Hardware Event-Based Sampling (lower overhead). The Overhead diagram on the right adjusts to your settings and shows how each of them impacts on the collection overhead:

Collect Context Switches
This option enables collection of thread context switches for hardware event-based sampling collection and is available in a custom hardware event-based sampling analysis configuration.
To disable/modify this option for custom analysis:
From GUI:
In the Configure Analysis window > HOW pane, click the Browse button and select the Custom Analysis > your_custom_analysis type.
In the custom analysis configuration, de-select the Collect context switches option.
From CLI:
Use the -knob enable-stack-collection=false option. For example:
vtune -collect-with runsa -knob enable-stack-collection=false -knob event-config=CPU_CLK_UNHALTED.REF_TSC:sa=1800000,CPU_CLK_UNHALTED /home/test/sample
Sampling Interval
This option configures the amount of wall-clock time the VTune Profiler waits before collecting each sample. The smaller the Sampling Interval, the larger the number of samples collected and written to the disk. The minimal value of the sampling interval depends on the system:
10 milliseconds for systems with a single CPU
15 milliseconds for systems with multi-core CPUs
To disable/modify the sampling interval value:
From GUI:
In the Configure Analysis window > HOW pane, click the Browse button and select an analysis type, for example, Hotspots and use the Hardware Event-based Sampling mode.
For the CPU sampling interval, ms option, specify a required value.
From CLI:
Use the -knob sampling-interval=<value> option. For example:
vtune -collect-with runss -knob sampling-interval=100 -knob cpu-samples-mode=stack -knob signals-mode=stack -knob waits-mode=stack -knob io-mode=stack /home/test/sample
Stack Size
This option is used to specify the size of a raw stack (in bytes) to process during hardware event-based sampling collection. Zero value means unlimited size. Possible values are numbers between 0 and 2147483647.
To disable/modify this option:
From GUI:
In the Configure Analysis window > HOW pane, click the Browse button and select the Custom Analysis > your_custom_analysis type.
In the custom configuration, decrease the Stack size, in bytes value.
From CLI:
Use the -stack-size option, for example:
vtune -collect-with runsa -knob enable-stack-collection=true -knob stack-size=8192 -knob enable-call-counts=true -app-working-dir /home/samples/nqueens_fortran -- /home/samples/nqueens_fortran/nqueens_parallel