A newer version of this document is available. Customers should click here to go to the newest version.
Visible to Intel only — GUID: GUID-CB75DEE3-75F1-446A-880F-EA50A619CBAF
Visible to Intel only — GUID: GUID-CB75DEE3-75F1-446A-880F-EA50A619CBAF
CPU/FPGA Interaction View
Use the CPU/FPGA Interaction viewpoint to assess FPGA performance of executed kernels, overall time for memory transfers between the CPU and FPGA, and how well a workload is balanced between the CPU and FPGA.
To interpret the performance data provided in the CPU/FPGA Interaction viewpoint, you may follow the steps below:
Define a Performance Baseline
Start with exploring the Summary window that provides general information on your application execution. Key areas for optimization include application execution time, tasks with high CPU or FPGA time, and kernel execution time.
Use the Elapsed Time value as a baseline for comparison of versions before and after optimization.
Assess FPGA Utilization
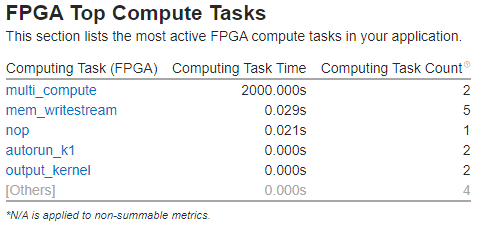
Look at the FPGA Top Compute Tasks list on the Summary window for a list of kernels running on the FPGA.

Switch to the Bottom-up window and use the Computing Task Purpose / Source Computing Task (FPGA) grouping to view the hotspots for kernels.
You can click a task from the FPGA Top Compute Tasks list to be taken to that task on the Bottom-up window.
Review the FPGA Utilization timeline, which shows how many kernels and transfers are executing at the same time on the FPGA.

Review Memory Transfers
Look at the Data Transferred column on the Bottom-up window or the Computing Queue rows on the Platform window to view the FPGA kernels and memory transfers.
Determine Workload Impact
The Context Switch Time metric on the Summary window shows the amount of time the CPU spent in context switches. Switch to the Platform window and hover over the timeline to view the reason for the context switch. In some cases, CPU context switches may represent CPU waits for the FPGA. Look at the FPGA Utilization line to identify times when the CPU may have been waiting on the FPGA and vice versa. For instance, when there is no FPGA activity, but CPU activity is high, it is likely that the FPGA is waiting for the CPU to complete a preparation step.
Review FPGA Device Metrics
Switch to the Bottom-up window to analyze Stalls, Global Bandwidth and Occupancy metrics and see how efficiently your kernels run on the FPGA device.
Analyze the Idle % metrics values to understand the percentage of cycles when there were no valid work-items executing or stalling the memory or channel instruction. The Activity % metric shows the percentage of cycles a predicated channel or memory instruction is enabled.
Analyze Channel Depth
In the Bottom-up window, locate the Average and Maximum Channel Depth information for selected instances. If required, adjust the channel depth for your needs.

If the channel is full all the time, the write side of the channel is working faster than the read side, and the channel will be stalling in the write kernel. If the channel is mostly empty, the read side is likely to be stalling, and if the channel is bigger than 32 bits deep, you can reduce it in size without a performance hit.
Analyze Loops
Analyze the occupancy for profiled loops:

Analyze Source of the Host Application Part
Double-click the function you want to optimize to view its related source code file in the Source/Assembly window. You can open the code editor directly from the Intel® VTune™ Profiler and edit your code (for example, minimizing the number of calls to the hotspot function).
Analyze Source of the Kernel Running on an FPGA Device
Double-click the kernel to see FPGA device metrics per the kernel source lines. Use the Source view to see what channels and memories cause most stalls and how much data they transfer.