A newer version of this document is available. Customers should click here to go to the newest version.
Pane: Options - General
To access this pane:
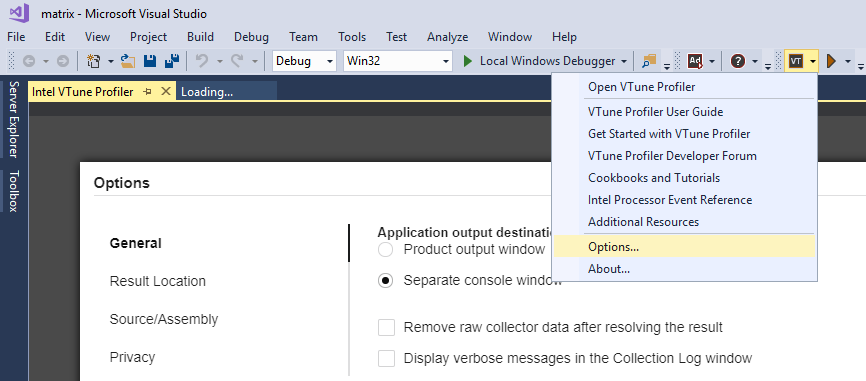
In the Microsoft Visual Studio IDE, click the pull-down menu next to the Open VTune Profiler icon ( ) and select Options:

From the standalone VTune Profiler interface: Click the  menu button and select Options... > Intel VTune Profiler version > General.
The following options are available:
Use This |
To Do This |
|---|---|
Application output destination options |
Choose the location for the output of the analyzed application:
|
Remove raw collector data after resolving the result check box |
Enable/disable removing raw collector data after finalizing the result. Removing raw data makes the result file smaller but prevents future re-finalization. |
Display verbose messages in the Collection Log window check box |
Enable/disable detailed collection status messages in the Collection Log window. Make sure to re-open the result to apply this change. |
Show all applicable viewpoints check box |
Display all applicable viewpoints in the viewpoint selector for every analysis type. |
Specify path to the adb executable field |
Specify the path to the adb executable used to access an Android* device for analysis with the VTune Profiler. |