Visible to Intel only — GUID: GUID-F79D8B93-F9B4-4ADC-BB51-6EC1E5CC1B16
Visible to Intel only — GUID: GUID-F79D8B93-F9B4-4ADC-BB51-6EC1E5CC1B16
Profile KVM Kernel and User Space on the KVM System
Install the VTune Profiler on the KVM system and configure your target for the KVM guest OS profiling.
For application analysis, you need to install the Intel® VTune™ Profiler directly on your guest OS. VTune Profiler installation detects a virtual environment and disables sampling drivers installation to avoid system instability. When the product is installed, proceed with project configuration by specifying your application as an analysis target and selecting an analysis type:

This profiling type supports two usage modes:
Both profiling modes are applicable to cloud environments but introduce some limitations.
Guest OS (User App) Profiling Mode
In this mode, the VTune Profiler supports user-mode sampling and tracing analysis types, Hotspots and Threading, for the applications running in the Launch or Attach mode. System-wide analysis is not supported.

Guest OS (Kernel and User Space) Profiling Mode
In this mode, the VTune Profiler provides limited event-based collection options for the Hotspots and Microarchitecture Exploration analyses and requires additional host system configuration to virtualize PMU counters.
To enable event-based sampling analysis on the KVM system:
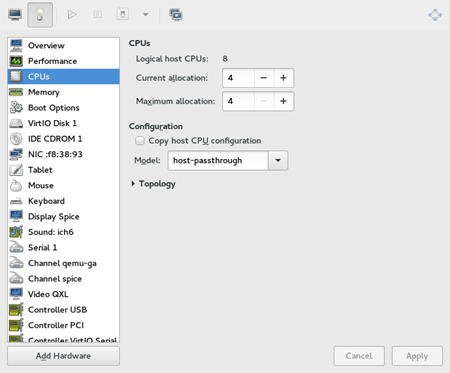
From the host system, open the configuration settings for the virtual machine.
Select the CPUs or Processor option on the left.
Enter host-passthrough into the Model field to pass through the host CPU features without modifying the guest system.
Click Apply to save the changes.

When you select a hardware event-based analysis type (for example, Microarchitecture Exploration), the VTune Profiler automatically enables a driverless event-based sampling collection using the Linux Perf* tool. For this analysis, the VTune Profiler collects only architectural events. See the Performance Monitoring Unit Sharing Guide for more details on the supported architectural events.
Limitations
User-mode sampling limitations:
Only Hotspots and Threading analyses are supported.
No system-wide analysis is available.
Hardware event-based sampling limitations:
Only Hotspots and limited Microarchitecture Exploration analyses are supported.
PEBS counters are not virtualized.
Uncore events are not available.
KVM modules and host system modules do not show up in the analysis result.
Data on the guest OS and your application modules show up as locally collected statistics with no [guest] markers.