A newer version of this document is available. Customers should click here to go to the newest version.
Visible to Intel only — GUID: GUID-FA99AD16-F1D1-4F6D-BC9A-E8A5122007D5
Visible to Intel only — GUID: GUID-FA99AD16-F1D1-4F6D-BC9A-E8A5122007D5
Linux* and Android* Kernel Analysis
Use an event library provided in the Custom Analysis configuration to select Linux* Ftrace* and Android* framework events to monitor with the event-based sampling collector.
To choose events from the library:
Create a new hardware event-based sampling analysis type.
The new analysis type shows up under Custom Analysis in the HOW pane of the Configure Analysis window.
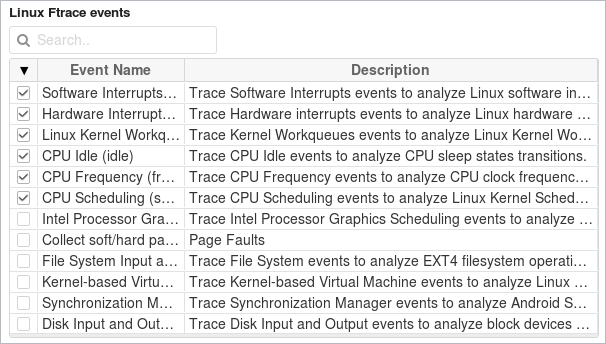
In the new custom configuration, use the Linux Ftrace events or Android framework events area to specify events for monitoring a system behavior:

For example, for KVM guest OS profiling consider selecting the following Linux Ftrace events to track IRQ injection process: kvm, irq, sofirq and workq.
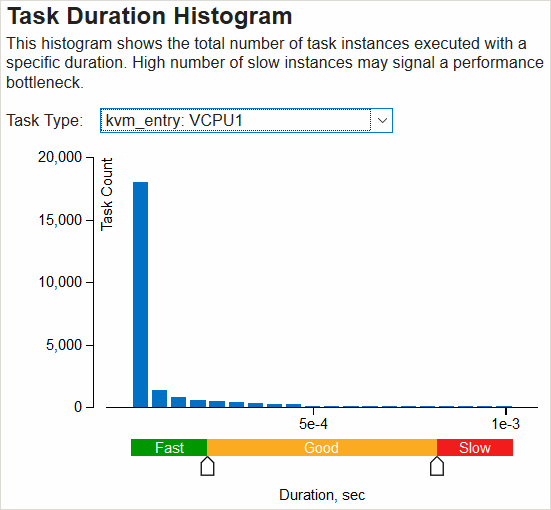
The collected data shows up as tasks in the default viewpoint. Start with the Summary window to identify the most time-consuming tasks in the Top Tasks section. Analyze task duration statistics presented by task type in the Task Duration histogram:

Use the sliders to set up thresholds for high and slow task instances.
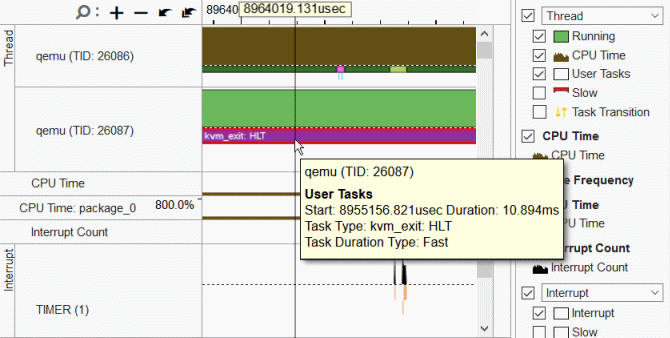
Clicking a task in the Top Tasks section opens the Bottom-up window grouped by tasks. To analyze tasks over time, switch to the Platform window:

Limitations
On some systems, the Linux Ftrace subsystem, located in the debugfs partition in /sys/kernel/debug/tracing, may be accessible for the root user only. In this case, the VTune Profiler provides an error message: Ftrace collection is not possible due to a lack of credentials. Root privileges are required. To enable Ftrace events collection on such a system, you may either run the VTune Profiler with root privileges or change permissions manually by using the chown command under the root account, for example:
$ chown -R <user>:<group> /sys/kernel/debug/tracing
You can automate this process by using the prepare_debugfs.sh script located in the bin directory. The script mounts debugfs, changes permissions to a desired group, and updates the install boot script to apply this change automatically on the system startup. To execute this script, make sure to use root privileges.
To change permissions automatically with the prepare_debugfs.sh script, enter:
$ ./install/bin64/prepare-debugfs.sh [option]
where [option] is one of the following:
Option |
Description |
|---|---|
-h | --help |
Display usage information. |
-i | --install |
Configure the autoload debugfs boot script and install it in the appropriate system directory. |
-c | --check |
Mount without options, script will configure debugfs and check permissions. |
-u | --uninstall |
Uninstall a previously installed debugfs boot script and revert configuration. |
-g | --group <group> |
Specify group other than vtune. |
-r | --revert |
Revert debugfs configuration. |
-b | --batch |
Run in a non-interactive mode (exiting in case of already changed permissions) without options. The script will configure debugfs. |