A newer version of this document is available. Customers should click here to go to the newest version.
Visible to Intel only — GUID: GUID-D42FA91D-4748-4D5B-BF34-E891F36BB73B
Visible to Intel only — GUID: GUID-D42FA91D-4748-4D5B-BF34-E891F36BB73B
Window: Summary - Microarchitecture Exploration
Use the Summary window as your starting point of the performance analysis with the Intel® VTune™ Profiler. To access this window, select the Microarchitecture Exploration viewpoint and click the Summary sub-tab in the result tab.
Depending on the analysis type, the Summary window provides the following application-level statistics in the Microarchitecture Exploration viewpoint:
You may click the  Copy to Clipboard button to copy the content of the selected summary section to the clipboard.
Microarchitecture Metric Diagram
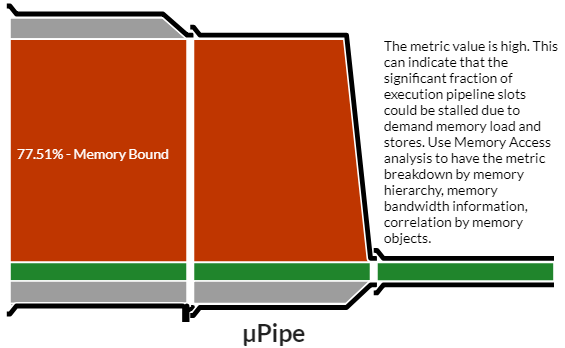
Start your analysis with the hardware metric diagram representing CPU inefficiencies based on the Top-Down Microarchitecture Analysis Method (TMA).
Treat the diagram as a pipe with an output flow equal to the ratio: Actual Instructions Retired/Possible Maximum Instruction Retired (pipe efficiency). If there are pipeline stalls decreasing retiring, the pipe shape gets narrow.
Analysis Metrics
The first section displays the summary statistics on the overall application execution per hardware-related metrics measured in Pipeline Slots or Clockticks. Metrics are organized by execution categories in a list and also represented as a µPipe diagram. To view a metric description, mouse over the help icon  :
:
In the example above, mousing over the L1 Bound metric displays the metric description in the tooltip.
A flagged metric value signals a performance issue for the whole application execution. Mouse over the flagged value to read the issue description:
You may use the performance issues identified by the VTune Profiler as a baseline for comparison of versions before and after optimization. Your primary performance indicator is the Elapsed time value.
Grayed out metric values indicate that the data collected for this metric is unreliable. This may happen, for example, if the number of samples collected for PMU events is too low. In this case, when you hover over such an unreliable metric value, the VTune Profiler displays a message:
You may either ignore this data, or rerun the collection with the data collection time, sampling interval, or workload increased.
By default, the VTune Profiler collects Microarchitecture Exploration data in the Detailed mode. In this mode, all metric names in the Summary view are hyperlinks. Clicking such a hyperlink opens the Bottom-up window and sorts the data in the grid by the selected metric. The lightweight Summary collection mode is limited to the Summary view statistics.
CPU Utilization Histogram
Explore the CPU Utilization Histogram to analyze the percentage of the wall time the specific number of CPUs were running simultaneously.

| Use This | To Do This |
|---|---|
Vertical bars |
Hover over the bar to identify the amount of Elapsed time the application spent using the specified number of logical CPUs. |
Target Utilization |
Identify the target CPU utilization. This number is equal to the number of logical CPUs. Consider this number as your optimization goal. |
Average CPU Utilization |
Identify the average number of CPUs used aggregating the entire run. It is calculated as CPU time / Elapsed time. CPU utilization at any point in time cannot surpass the available number of logical CPUs. Even when the system is oversubscribed, and there are more threads running than CPUs, the CPU utilization is the same as the number of CPUs. Use this number as a baseline for your performance measurements. The closer this number to the number of logical CPUs, the better, except for the case when the CPU time goes to spinning. |
Utilization Indicator bar |
Analyze how the various utilization levels map to the number of simultaneously utilized logical CPUs.
NOTE:
In the CPU Utilization histogram, the VTune Profiler treats the Spin and Overhead time as Idle CPU utilization. Different analysis types may recognize Spin and Overhead time differently depending on availability of call stack information. This may result in a difference of CPU Utilization graphical representation per analysis type. |
The Effective CPU Utilization Histogram is available for Microarchitecture Exploration results collected in the Detailed mode only.
Collection and Platform Info
This section provides the following data:
Application Command Line |
Path to the target application. |
Operating System |
Operating system used for the collection. |
Computer Name |
Name of the computer used for the collection. |
Result Size |
Size of the result collected by the VTune Profiler. |
Collection start time |
Start time (in UTC format) of the external collection. Explore the Timeline pane to track the performance statistics provided by the custom collector over time. |
Collection stop time |
Stop time (in UTC format) of the external collection. Explore the Timeline pane to track the performance statistics provided by the custom collector over time. |
Collector type |
Type of the data collector used for the analysis. The following types are possible:
|
CPU Information |
|
Name |
Name of the processor used for the collection. |
Frequency |
Frequency of the processor used for the collection. |
Logical CPU Count |
Logical CPU count for the machine used for the collection. |
Physical Core Count |
Number of physical cores on the system. |
User Name |
User launching the data collection. This field is available if you enabled the per-user event-based sampling collection mode during the product installation. |
GPU Information |
|
Name |
Name of the Graphics installed on the system. |
Vendor |
GPU vendor. |
Driver |
Version of the graphics driver installed on the system. |
Stepping |
Microprocessor version. |
EU Count |
Number of execution units (EUs) in the Render and GPGPU engine. This data is Intel® HD Graphics and Intel® Iris® Graphics (further: Intel Graphics) specific. |
Max EU Thread Count |
Maximum number of threads per execution unit. This data is Intel Graphics specific. |
Max Core Frequency |
Maximum frequency of the Graphics processor. This data is Intel Graphics specific. |
Graphics Performance Analysis |
GPU metrics collection is enabled on the hardware level. This data is Intel Graphics specific.
NOTE:
Some systems disable collection of extended metrics such as L3 misses, memory accesses, sampler busyness, SLM accesses, and others in the BIOS. On some systems you can set a BIOS option to enable this collection. The presence or absence of the option and its name are BIOS vendor specific. Look for the Intel® Graphics Performance Analyzers option (or similar) in your BIOS and set it to Enabled. |