A newer version of this document is available. Customers should click here to go to the newest version.
NPU Exploration View
Use the NPU Exploration viewpoint to assess and optimize the performance of AI or ML workloads on Intel Neural Processing Units (NPU).
When the NPU Exploration analysis executes, Intel® VTune™ Profiler collects NOC metric set data about the DDR bandwidth between the NPU and DDR memory. Once data collection completes, Intel® VTune™ Profiler prepares the results and displays them in the Summary window.
NPU Exploration Summary
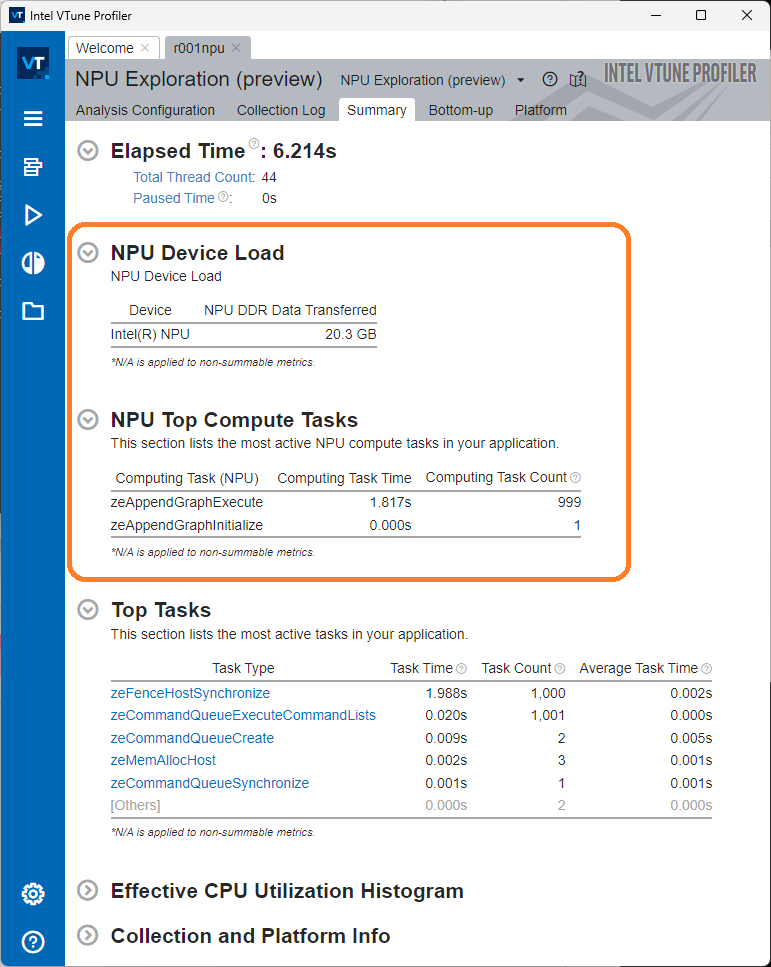
The Summary window displays NPU performance data starting with these sections:
- NPU Device Load - This section indicates the amount of data transferred between the NPU and DDR memory.
- NPU Top Compute Tasks - This section captures the total amount of time when tasks got executed on the VPU.

Next, see the list of Top Tasks to review the various host tasks which offloaded work onto the NPU.
NPU Exploration Bottom-up Window
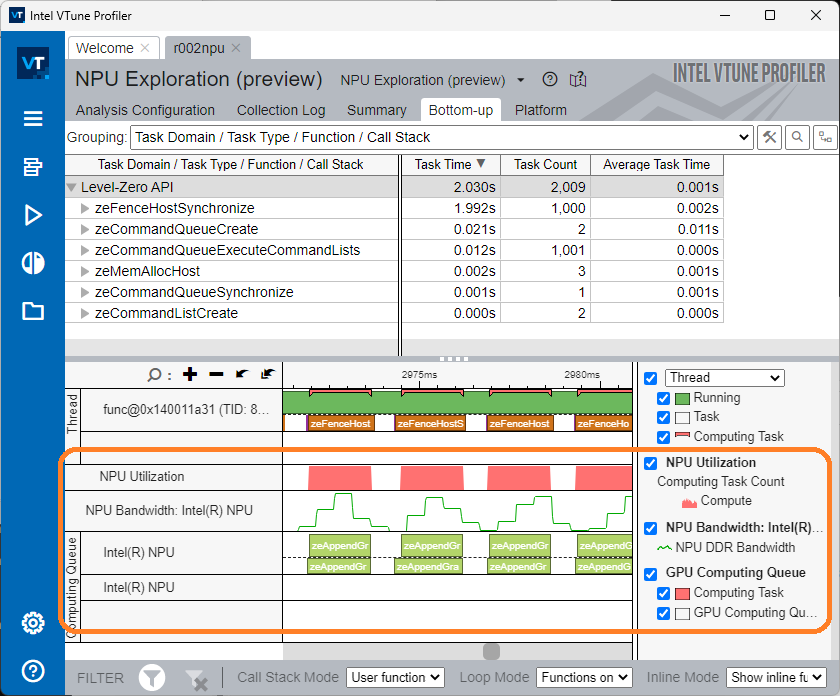
Continue your examination of host tasks by switching to the Bottom-up window. In the Grouping pull down menu, select the Task Domain / Task Type / Function / Call Stack grouping.

See the execution of device tasks from the instant they started. This is the instant when the task was appended to the Computing Queue.
In the Computing Queue section, the portion of the graph above the dotted line indicates duration when the task was executed on the NPU.
The portion of the graph below the dotted line indicates the duration for which the task was waiting in the queue for execution on the NPU. Tasks are removed from the Computing Queue when they finish executing on the NPU.