A newer version of this document is available. Customers should click here to go to the newest version.
Visible to Intel only — GUID: GUID-85900EB5-1759-48AC-9458-E0B8C7D1320E
Visible to Intel only — GUID: GUID-85900EB5-1759-48AC-9458-E0B8C7D1320E
Window: Summary - Input and Output Summary
Use the Summary window as your starting point of the performance analysis with the Intel® VTune™ Profiler. To access this window, select the Input and Output viewpoint and click the Summary sub-tab in the result tab.
Depending on your analysis target, the Summary window provides the following application and system-level statistics in the Disk Input and Output viewpoint:
Click a metric or an object name represented in the Summary window as a hyperlink to open the Bottom-up window with the grid data sorted by the selected metric or the selected object highlighted. By default, the grid data is grouped by Thread/Page Faults, which helps you easier
Сlick the
 Copy to Clipboard button to copy the content of the selected summary section to the clipboard.
Analysis Metrics
Explore the list of CPU metrics to understand high-level statistics of an overall application execution.
For Linux* targets, Intel® VTune™ Profiler introduces the I/O Wait Time metric that helps you estimate whether your application is I/O-bound:
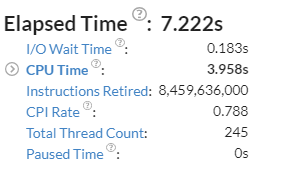
The I/O Wait Time metric represents a portion of time when threads reside in I/O wait state while there are idle cores on the system. For every moment of time the number of counted threads does not exceed the number of idling cores on a system. This aggregated I/O Wait Time metric is an integral function of I/O Wait metric that is available in the Timeline pane of the Bottom-up view. If you see that the I/O Wait Time is a substantial part of the application Elapsed Time, as in the example above, switch to the Platform window to have a closer look at all the metrics on the timeline and understand what caused high I/O Wait time.
VTune Profiler analyzes metrics, compares their values with the threshold values provided by Intel architects, and, if the threshold is exceeded, it flags the metric value as a performance issue for an application as a whole. Mouse over the flagged value to read an issue description and tuning recommendation.
Bandwidth Utilization Histogram
This histogram shows how much time the system bandwidth was utilized by a certain value (Bandwidth Domain) and provides thresholds to categorize bandwidth utilization as High, Medium and Low. You can set the threshold by moving sliders at the bottom.
This histogram is available if you collected results with the Analyze memory bandwidth option enabled.
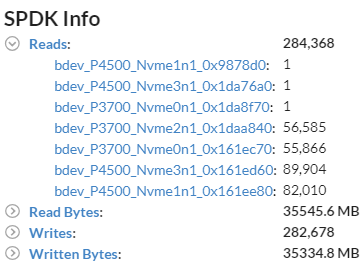
SPDK Info
Explore SDPK Info section for overall IO performance statistics. To see how each device performed per operation or metric, expand a corresponding block and identify potential IO performance imbalance among SSDs:
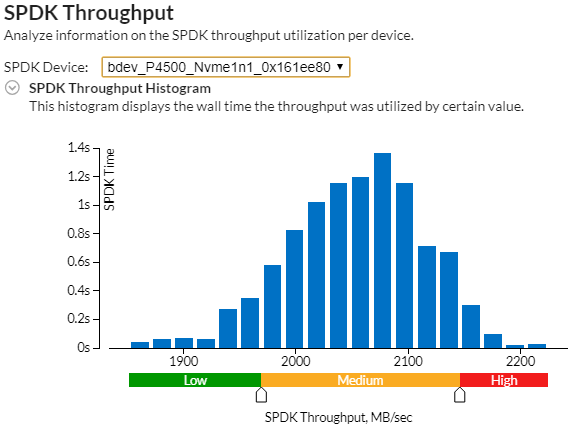
SPDK Throughput
Explore the SPDK Throughput histogram and table to identify how long your workload has been under-utilizing the throughout of the selected SPDK device (Low utilization level):
Top Hotspots
VTune Profiler displays the most performance-critical functions and their CPU Time in the Top Hotspots section. Optimizing these functions typically results in improving overall application performance. Clicking a function in the list opens the Bottom-up window with this function selected.
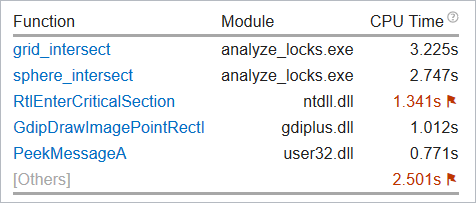
The grayed-out [Others] module, if provided, displays the total value for all other functions in the application that are not included into this table.
You can control the number of objects in this list and displayed metrics via the viewpoint configuration file.
Disk Input and Output Histogram
The Disk Input and Output histogram shows how quickly storage requests are served by the kernel sub-system and helps quickly estimate latency distribution and identify slow I/O requests.
The X-axis shows the time it took to satisfy a storage request and the Y-axis shows the number of I/O requests in this category. Use the Operation type drop-down menu to select the type of an I/O operation you are interested in. For example, for the write type of I/O operations, type of I/O operations, 30 storage requests in all executed for more than 0.03 seconds are qualified by the VTune Profiler as slow:
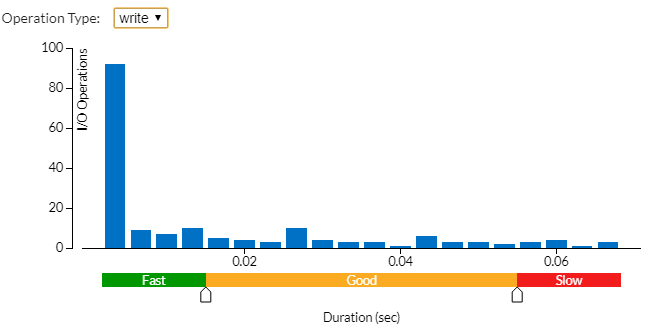
To get more details on this type I/O request, switch to the Timeline pane in the Bottom-up window.
Collection and Platform Info
This section provides the following data:
Application Command Line |
Path to the target application. |
Operating System |
Operating system used for the collection. |
Computer Name |
Name of the computer used for the collection. |
Result Size |
Size of the result collected by the VTune Profiler. |
Collection start time |
Start time (in UTC format) of the external collection. Explore the Timeline pane to track the performance statistics provided by the custom collector over time. |
Collection stop time |
Stop time (in UTC format) of the external collection. Explore the Timeline pane to track the performance statistics provided by the custom collector over time. |
Collector type |
Type of the data collector used for the analysis. The following types are possible:
|
CPU Information |
|
Name |
Name of the processor used for the collection. |
Frequency |
Frequency of the processor used for the collection. |
Logical CPU Count |
Logical CPU count for the machine used for the collection. |
Physical Core Count |
Number of physical cores on the system. |
User Name |
User launching the data collection. This field is available if you enabled the per-user event-based sampling collection mode during the product installation. |
GPU Information |
|
Name |
Name of the Graphics installed on the system. |
Vendor |
GPU vendor. |
Driver |
Version of the graphics driver installed on the system. |
Stepping |
Microprocessor version. |
EU Count |
Number of execution units (EUs) in the Render and GPGPU engine. This data is Intel® HD Graphics and Intel® Iris® Graphics (further: Intel Graphics) specific. |
Max EU Thread Count |
Maximum number of threads per execution unit. This data is Intel Graphics specific. |
Max Core Frequency |
Maximum frequency of the Graphics processor. This data is Intel Graphics specific. |
Graphics Performance Analysis |
GPU metrics collection is enabled on the hardware level. This data is Intel Graphics specific.
NOTE:
Some systems disable collection of extended metrics such as L3 misses, memory accesses, sampler busyness, SLM accesses, and others in the BIOS. On some systems you can set a BIOS option to enable this collection. The presence or absence of the option and its name are BIOS vendor specific. Look for the Intel® Graphics Performance Analyzers option (or similar) in your BIOS and set it to Enabled. |