A newer version of this document is available. Customers should click here to go to the newest version.
Visible to Intel only — GUID: GUID-217E13FA-40DB-45AE-96EC-2854C9B1ECBA
Visible to Intel only — GUID: GUID-217E13FA-40DB-45AE-96EC-2854C9B1ECBA
Hardware Event List
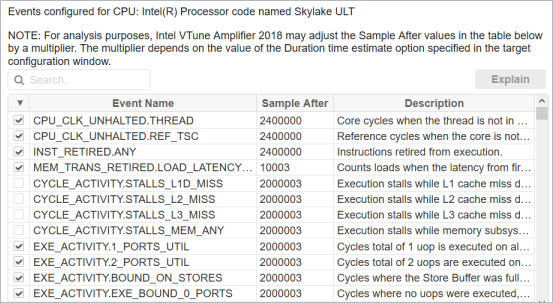
If required, edit a list of PMU events monitored by the Intel® VTune™ Profiler for your processor by modifying an existing or creating a new hardware event-based sampling (EBS) analysis configuration.
To add events:
- In the HOW pane, select an existing hardware event-based analysis (for example, Microarchitecture Exploration) and click the
 Copy button to create a custom copy of this configuration.
The new analysis type shows up under the Custom Analysis group in the HOW pane.
- From the list of PMU events supported for the current platform, select the events you want the VTune Profiler to monitor in your new configuration.

You may select an event and click the Explain... button at the bottom to open the Intel Processor Event Reference and read more details on the selected event.
To filter in/out the event list for particular event(s), specify search keywords (applied to both the Event Name and Event Description columns) in the Filter field.
NOTE:Usually precise events have a _PS postfix (for example, UOPS_RETIRED.RETIRE_SLOTS_PS) and/or a clear indication (Precise Event) in the Event Description column.
- Click Start to run your new analysis configuration.
You may configure the VTune Profiler to monitor all the events in a single collection run using event multiplexing or allow multiple runs to collect more precise event data.