A newer version of this document is available. Customers should click here to go to the newest version.
GPU Compute/Media Hotspots Analysis (Preview)
Analyze the most time-consuming GPU kernels, characterize GPU usage based on GPU hardware metrics, identify performance issues caused by memory latency or inefficient kernel algorithms, and analyze GPU instruction frequency per certain instruction types.
This is a PREVIEW FEATURE. A preview feature may or may not appear in a future production release. It is available for your use in the hopes that you will provide feedback on its usefulness and help determine its future. Data collected with a preview feature is not guaranteed to be backward compatible with future releases.
Use the GPU Compute/Media Hotspots analysis to:
Explore GPU kernels with high GPU utilization, estimate the effectiveness of this utilization, identify possible reasons for stalls or low occupancy and options.
Explore the performance of your application per selected GPU metrics over time.
Analyze the hottest SYCL* standards or OpenCL™ kernels for inefficient kernel code algorithms or incorrect work item configuration.
The GPU Compute/Media Hotspots analysis is a good next step if you have already run the GPU Offload analysis and identified:
a performance-critical kernel for further analysis and optimization;
a performance-critical kernel that it is tightly connected with other kernels in the program and may slow down their performance.
How It Works: Intel Graphics Render Engine and Hardware Metrics
A GPU is a highly parallel machine where an array of small cores, or execution units (EUs), do graphical or computational work. Each EU simultaneously runs several lightweight threads. When one of these threads is picked up for an execution, it can hide stalls in the other threads if the other threads are stalled waiting for data from memory or other units.
To use a full potential of the GPU, applications should enable the scheduling of as many threads as possible and minimize idle cycles. Minimizing stalls is also very important for graphics and general purpose computing GPU applications.
VTune Profiler can monitor Intel Graphics hardware events and display metrics about integral GPU resource usage over a sampled period, for example, ratio of cycles when EUs were idle, stalled, or active as well as statistics on memory accesses and other functional units. If the VTune Profiler traces GPU kernel execution, it annotates each kernel with GPU metrics.
The scheme below displays metrics collected by the VTune Profiler across different parts of the Intel® Processor Graphics Gen9:
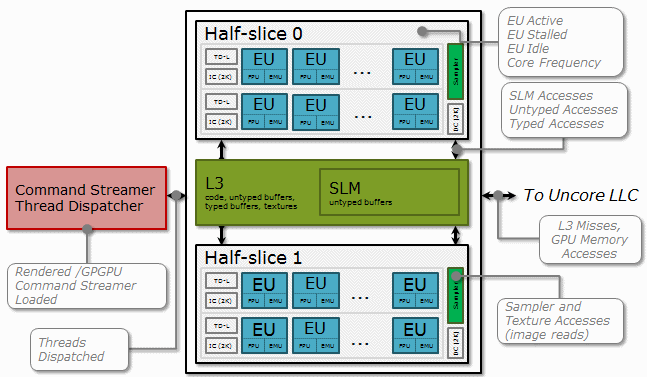
GPU metrics help identify how efficiently GPU hardware resources are used and whether any performance improvements are possible. Many metrics are represented as a ratio of cycles when the GPU functional unit(s) is in a specific state over all the cycles available for a sampling period.
Configure the Analysis
Make sure you set up the system and enable required permissions for GPU analysis.
For SYCL applications: make sure to compile your code with the -gline-tables-only and -fdebug-info-for-profiling Intel oneAPI DPC++ Compiler options.
Create a project and specify an analysis system and target.
Run the Analysis
Click the
 (standalone GUI)/
 (Visual Studio IDE) Configure Analysis toolbar button to open the Configure Analysis window .
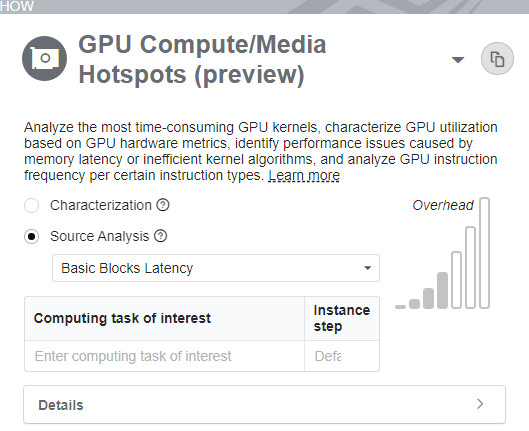
 Click anywhere in the title bar of the HOW pane. Open the Analysis Tree and select GPU Compute/Media Hotspots (Preview) analysis from the Accelerators group. This analysis is pre-configured to collect GPU usage data, analyze GPU task scheduling and identify whether your application is CPU or GPU bound.
NOTE:If you have multiple Intel GPUs connected to your system, run the analysis on the GPU of your choice or on all connected devices. For more information, see Analyze Multiple GPUs.
Choose and configure one of these analysis modes:
- Optionally, narrow down the analysis to specific kernels you identified as performance-critical (stalled or time-consuming) in the GPU Offload analysis, and specify them as Computing tasks of interest to profile. If required, modify the Instance step for each kernel, which is a sampling interval (in the number of kernels). This option helps reduce profiling overhead.
- (Optional) To collect data on energy consumption, check the Analyze power usage option. This feature is available when you profile applications in a Linux environment and use an Intel® Iris® X e MAX graphics discrete GPU.
For GPUs with interconnect (Xe Link) connections, use the Analyze Xe Link Usage option to examine the traffic between GPU interconnects (or Xe links). This information can help you assess data flow between GPUs and the usage of their interconnects.
Click Start to run the analysis.
Run from Command Line
To run the GPU Compute/Media Hotspots analysis from the command line, type:
vtune -collect gpu-hotspots [-knob <knob_name=knob_option>] -- <target> [target_options]
To generate the command line for this configuration, use the Command Line... button at the bottom.
Analyze Multiple GPUs
If you connect multiple Intel GPUs to your system, VTune Profiler identifies all of these adapters in the Target GPU pulldown menu. Follow these guidelines:
- Use the Target GPU pulldown menu to specify the device you want to profile.
- The Target GPU pulldown menu displays only when VTune Profiler detects multiple GPUs running on the system. The menu then displays the name of each GPU with the bus/device/function (BDF) of its adapter. You can also find this information on your Windows (see Task Manager) or Linux (run lspci) system.
- If you do not select a GPU, VTune Profiler selects the most recent device family in the list by default.
- Select All devices to run the analysis on all of the GPUs connected to your system.
- Full compute set in Characterization mode is not available for multi-adapter/tile analysis.
Once the analysis completes, VTune Profiler displays summary results per GPU including tile information in the Summary window.
Analysis Results
Once the GPU Compute/Media Hotspots Analysis completes data collection, the Summary window displays metrics that describe:
- GPU time
- Occupancy
- Peak occupancy you can expect with the existing computing task configuration
- The most active computing tasks that ran on the GPU
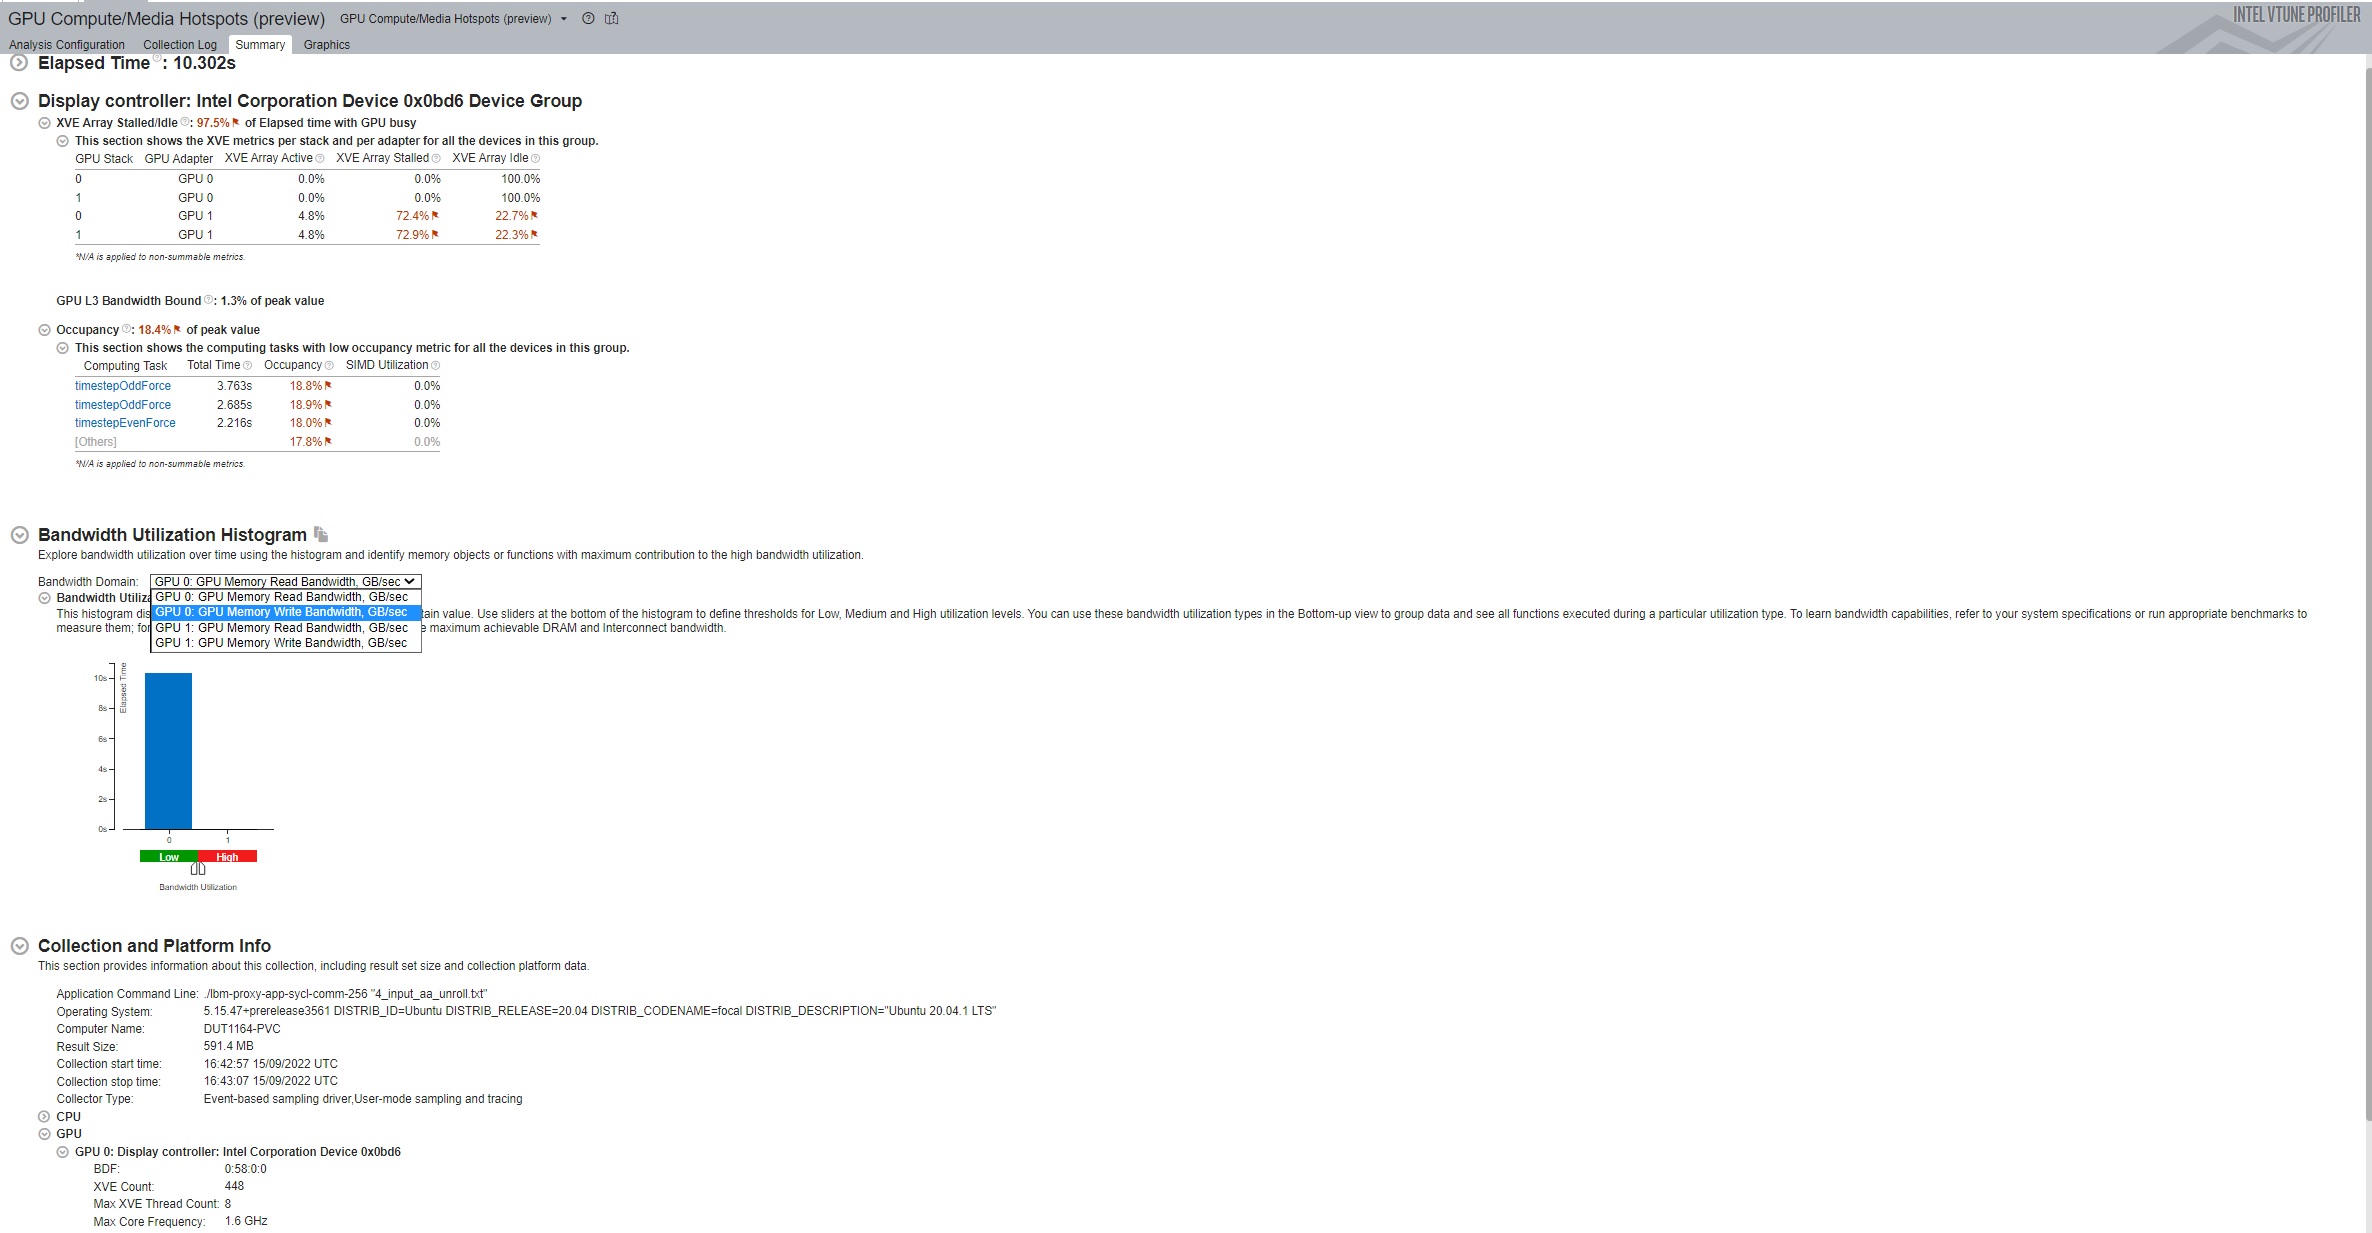
When you profile an application running on multiple Intel® GPUs, the Summary window of the GPU Compute/Media Hotspots Analysis displays results by grouping GPUs of the same Intel microarchitecture. Each architecture group then contains metric information for that group.
For each architecture group, you can see the values for these metrics:
- Occupancy
- GPU L3 Bandwidth Bound
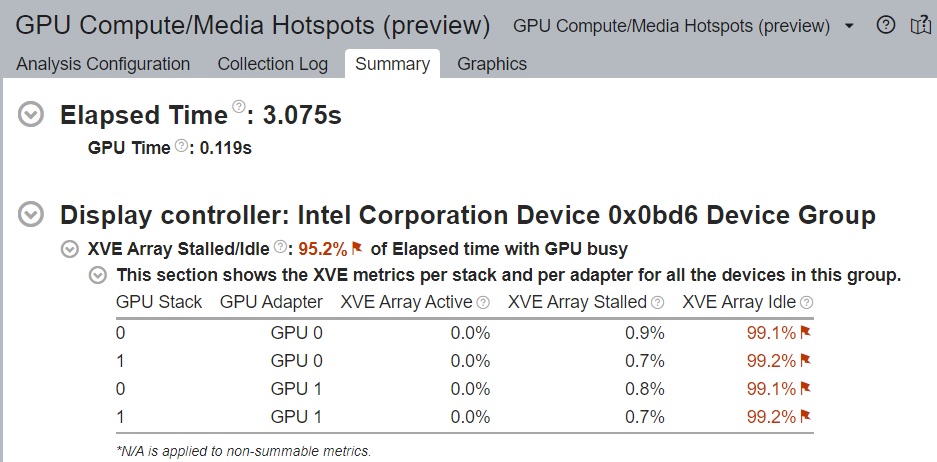
For every adapter in an architecture group, you can also see the values for the XVE Array Active/Stalled/Idle metrics.
Naming Convention for GPU Adapters
The results of GPU profiling analyses use aliases to refer to GPU adapters. .
- Aliases identify GPU adapters in the Summary, Grid, and Timeline sections of profiling results. The full names of GPU adapters display in the Collection and Platform Information sections, along with BDF details.
- A single alias identifies a GPU adapter for all results collected on the same machine.
- Aliases follow the naming convention GPU 0,GPU 1, and so on.
- The assignment of aliases happens in this order:
- Intel GPU adapters, starting with the lowest PCI address
- Non-Intel GPU adapters
- Other software devices like drivers
The GPU Topology Diagram
When you run a GPU analysis across multiple Intel GPUs (or multi-stack GPUs) connected to your system, the Summary window displays interconnections between these GPUs in the GPU Topology diagram. This diagram contains cross-GPU information for a maximum of 2 sockets and 6 GPUs connected to the system.
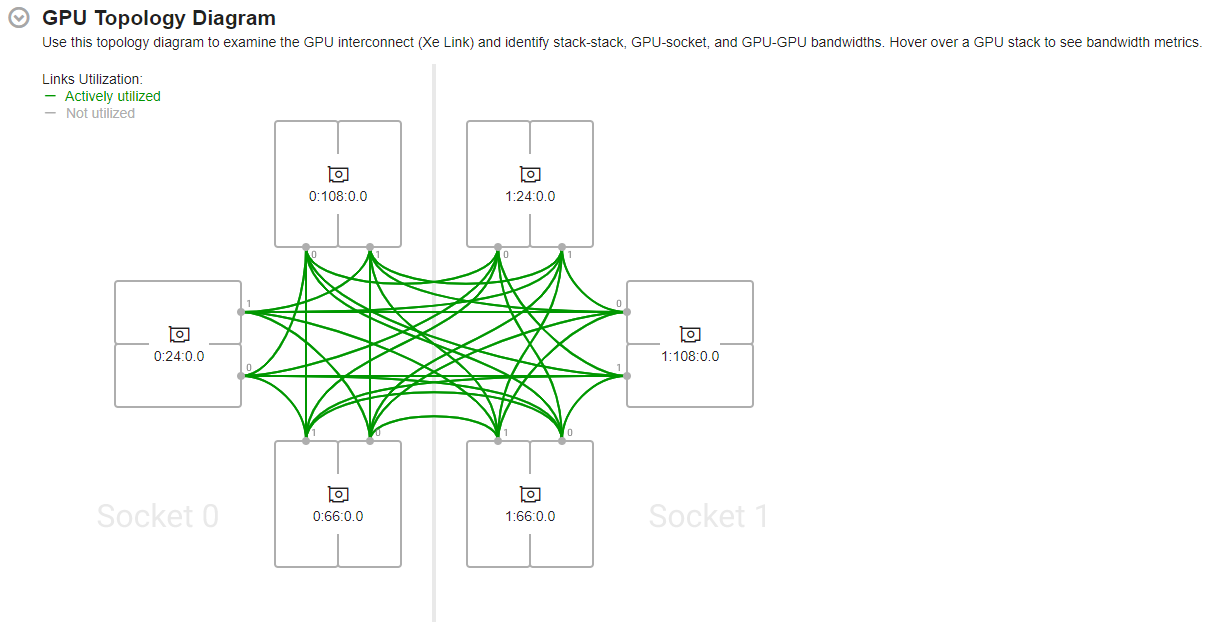
The GPU Topology diagram displays topological information about the sockets (available for GPU connection) as well as interconnect (Xe Link) connections between GPUs. You can identify GPUs in the GPU Topology diagram by their Bus Device Function (BDF) numbers.
Hover over a GPU stack to see actively utilized links (highlighted in green) and corresponding bandwidth metrics.
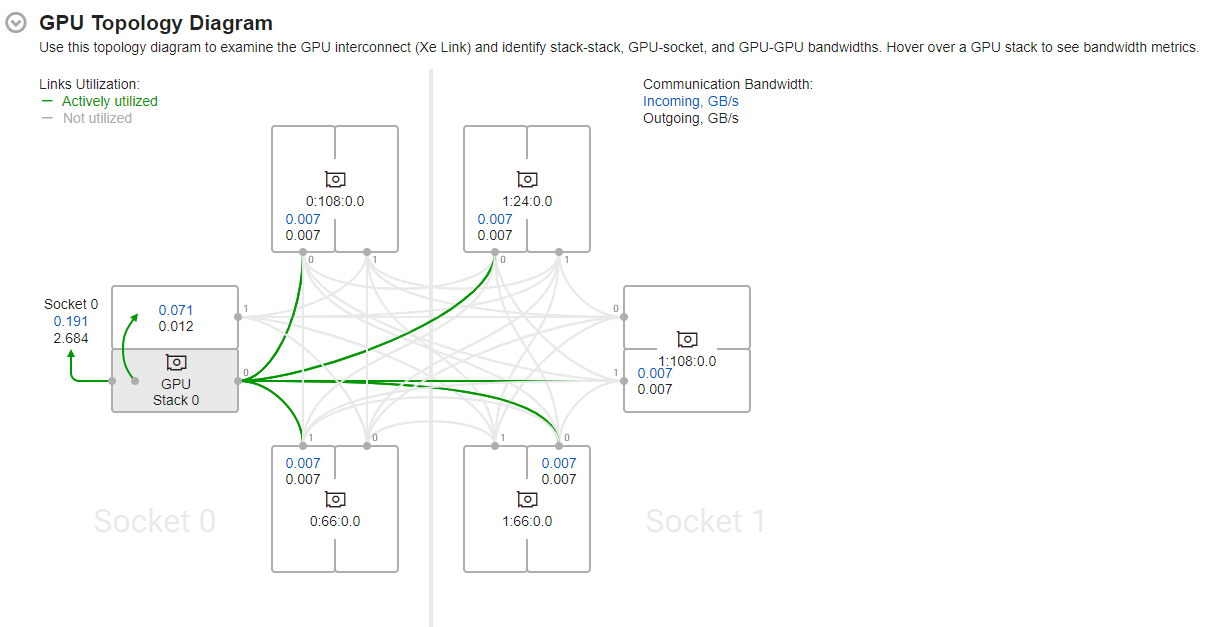
Use the information presented here to see average data transferred:
- Through Xe Links
- Between GPU stacks
- Between GPUs and sockets
Analyze Xe Link Usage
For GPUs with Xe Link connections, when you check the option (before running the analysis) to analyze interconnect (Xe Link) usage, the Summary window includes a section that displays the aggregated bandwidth and traffic data through GPU interconnects (Xe Link). Use this information with the GPU Topology diagram to detect any imbalances in the distribution of traffic between GPUs. See if some links are used more frequently than others, and understand why this is happening.
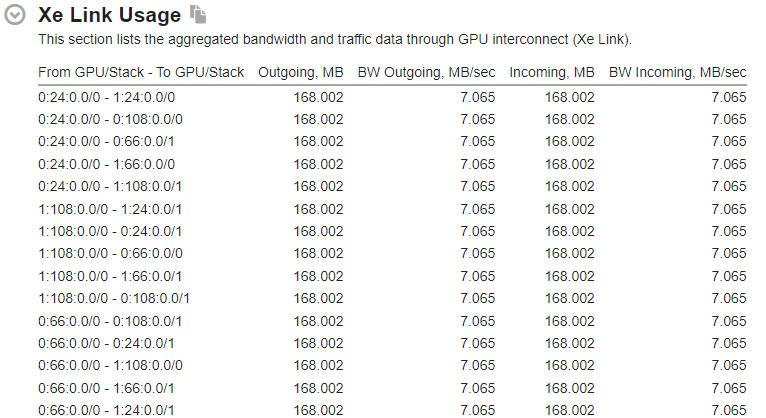
Along with the Xe Link usage information in the Summary window, the Platform window displays bandwidth data over time.
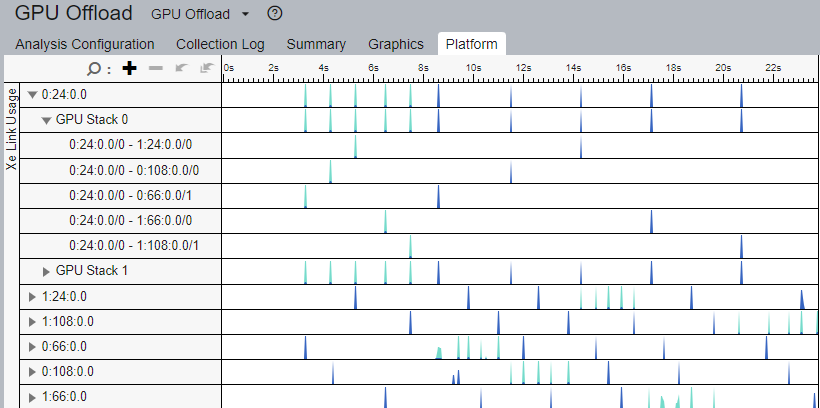
Use this information to:
- Match traffic data with kernels or code execution.
- See the bandwidth during any time of the execution of the application.
- Understand how the use of Xe Links improves the performance of your application.
- Verify if the Xe Links reached the bandwidth expected during application execution.
Configure Characterization Analysis
Use the Characterization configuration option to:
- Monitor the Render and GPGPU engine usage (Intel Graphics only)
- Identify the loaded parts of the engine
- Correlate GPU and CPU data
When you select the Characterization radio button, you can select platform-specific presets of GPU metrics. With the exception of the Dynamic Instruction Count preset, all other presets collect the following data about the activity of Execution Units (EU):
- EU Array Active
- EU Array Stalled
- EU Array Idle
- Computing Threads Started
- Thread Occupancy
- Core Frequency
Each preset introduces additional metrics:
The Overview metric set includes additional metrics that track general GPU memory accesses such as Memory Read/Write Bandwidth and XVE pipelines utilization. These metrics can be useful for both graphics and compute-intensive applications.
The Global Memory Accesses metric group includes additional metrics that show the bandwidth between the GPU and system memory as well as bandwidth between GPU stacks. The farther a memory level is located from an XVE, the greater the impact on its performance by unnecessary access operations to the memory level.
The LSE/SLM Accesses metric group includes metrics which cover the XVE to L1 cache traffic. This metric group requires two application runs to collect information.
The HDC Accesses metric group includes metrics which measure the traffic between XVE and L3, that is passing by the L1 cache.
The Full Compute metric group is a combination of all of the other event sets. Therefore, it requires multiple application runs.
The Dynamic Instruction Count metric group counts the execution frequency of specific classes of instructions. With this metric group, you also get an insight into the efficiency of SIMD utilization by each kernel.
You can run the GPU Compute/Media Hotspots analysis in Characterization mode for Windows*and Linux* targets. However, for all presets (with the exception of the Dynamic Instruction Count preset), you must have root/administrative privileges to run the GPU Compute/Media Hotspots analysis in Characterization mode.
Alternatively, on Linux* systems, you can configure the system to allow further collections for non-privileged users. To do this, in the bin64 folder of your installation directory, run the prepare-debugfs-and-gpu-environment.sh script with root privileges.
Additional Data for Characterization Analysis
Use the Trace GPU programming APIs option to analyze SYCL, OpenCL™, or Intel Media SDK programs running on Intel Processor Graphics. This option may affect the performance of your application on the CPU side.
For SYCL or OpenCL applications, identify the hottest kernels and the GPU architecture block that contains a performance issue for a particular kernel.
For Intel Media SDK programs, examine the execution of Intel Media SDK tasks on the timeline. Correlate this data with GPU usage at each instant.
For OpenCL kernels, you can run the characterization analysis for Windows and Linux targets running on Intel Graphics.
The Intel Media SDK program analysis is available for Windows and Linux targets running on Intel Graphics.
The characterization analysis supports the Launch Application and Attach to Process target types only.
The Level Zero runtime does not support the Attach to Process target type.
When profiling OpenCL kernels in the Attach to Process mode, if you attached to a process when the computing queue is already created, VTune Profiler does not display data for the OpenCL kernels in this queue.
To collect the data required to compute memory bandwidth, use the Analyze memory bandwidth option . For this analysis, install Intel sampling drivers first.
Use the GPU sampling internal, ms field to specify an interval (in milliseconds) between GPU samples for GPU hardware metrics collection. By default, VTune Profiler uses an interval of 1ms.
Configure Source Analysis
In the Source Analysis, VTune Profiler helps you identify performance-critical basic blocks, issues caused by memory accesses in the GPU kernels.
When you select the Source Analysis radio button, the configuration pane expands a drop-down menu where you can select a profiling mode to specify a type of issues you want to analyze:
- Basic Block Latency option helps you identify issues caused by algorithm inefficiencies. In this mode, VTune Profiler measures the execution time of all basic blocks. Basic block is a straight-line code sequence that has a single entry point at the beginning of the sequence and a single exit point at the end of this sequence. During post-processing, VTune Profiler calculates the execution time for each instruction in the basic block. So, this mode helps understand which operations are more expensive.
- Memory Latency option helps identify latency issues caused by memory accesses. In this mode, VTune Profiler profiles memory read/synchronization instructions to estimate their impact on the kernel execution time. Consider using this option, if you ran the GPU Compute/Media Hotspots analysis in the Characterization mode, identified that the GPU kernel is throughput or memory-bound, and want to explore which memory read/synchronization instructions from the same basic block take more time.
In the Basic Block Latency or Memory Latency profiling modes, the GPU Compute/Media Hotspots analysis uses these metrics:
Estimated GPU Cycles: The average number of cycles spent by the GPU executing the profiled instructions.
Average Latency: The average latency of the memory read and synchronization instructions, in cycles.
GPU Instructions Executed per Instance: The average number of GPU instructions executed per one kernel instance.
GPU Instructions Executed per Thread: The average number of GPU instructions executed by one thread per one kernel instance.
If you enable the Instruction count profiling mode, VTune Profiler shows a breakdown of instructions executed by the kernel in the following groups:

Control Flow group |
if, else, endif, while, break, cont, call, calla, ret, goto, jmpi, brd, brc, join, halt and mov, add instructions that explicitly change the ip register. |
Send & Wait group |
send, sends, sendc, sendsc, wait |
Int16 & HP Float | Int32 & SP Float | Int64 & DP Float groups |
Bit operations (only for integer types): and, or, xor, and others. Arithmetic operations: mul, sub, and others; avg, frc, mac, mach, mad, madm. Vector arithmetic operations: line, dp2, dp4, and others. Extended math operations. |
Other group |
Contains all other operations including nop. |
In the Instruction count mode, the VTune Profiler also provides Operations per second metrics calculated as a weighted sum of the following executed instructions:
Bit operations (only for integer types):
- and, not, or, xor, asr, shr, shl, bfrev, bfe, bfi1, bfi2, ror, rol - weight 1
Arithmetic operations:
add, addc, cmp, cmpn, mul, rndu, rndd, rnde, rndz, sub - weight 1
avg, frc, mac, mach, mad, madm - weight 2
Vector arithmetic operations:
- line - weight 2
- dp2, sad2 - weight 3
- lrp, pln, sada2 - weight 4
- dp3 - weight 5
- dph - weight 6
- dp4 - weight 7
- dp4a - weight 8
Extended math operations:
math.inv, math.log, math.exp, math.sqrt, math.rsq, math.sin, math.cos (weight 4)
math.fdiv, math.pow (weight 8)
The type of an operation is determined by the type of a destination operand.
View Data
VTune Profiler runs the analysis and opens the data in the GPU Compute/Media Hotspots viewpoint providing various platform data in the following windows:
Summary window displays overall and per-engine GPU usage, percentage of time the EUs were stalled or idle with potential reasons for this, and the hottest GPU computing tasks.
Graphics window displays CPU and GPU usage data per thread and provides an extended list of GPU hardware metrics that help analyze accesses to different types of GPU memory. For GPU metrics description, hover over the column name in the grid or right-click and select the What's This Column? context menu option.
Support for SYCL* Applications using oneAPI Level Zero API
This section describes support in the GPU Compute/Media Hotspots analysis for SYCL applications that run OpenCL or oneAPI Level Zero API in the back end. VTune Profiler supports version 0.91.10 of the oneAPI Level Zero API.
Support Aspect |
SYCL application with OpenCL as back end |
SYCL application with Level Zero as back end |
|---|---|---|
Operating System |
Linux OS Windows OS |
Linux OS Windows OS |
Data collection |
VTune Profiler collects and shows GPU computing tasks and the GPU computing queue. |
VTune Profiler collects and shows GPU computing tasks and the GPU computing queue. |
Data display |
VTune Profiler maps the collected GPU HW metrics to specific kernels and displays them on a diagram. |
VTune Profiler maps the collected GPU HW metrics to specific kernels and displays them on a diagram. |
Display Host side API calls |
Yes |
Yes |
Source Assembler for computing tasks |
Yes |
Yes |
Instrumentation for GPU code (Source Analysis option or Dynamic Instruction Count characterization option) |
Yes |
Yes |
For a use case on profiling a SYCL application running on an Intel GPU, see Profiling a SYCL App Running on a GPU in the Intel® VTune Profiler Performance Analysis Cookbook .
Support for DirectX Applications
This section describes support available in the GPU analysis to trace Microsoft® DirectX* applications running on the CPU host. This support is available in the Launch Application mode only.
| Support Aspect | DirectX Application |
|---|---|
Operating system |
Windows OS |
API version |
DXGI, Direct3D 11, Direct3D 12, Direct3D 11 on 12 |
Display host side API calls |
Yes |
Direct Machine Learning (DirectML) API |
Yes |
Device side computing tasks |
No |
Source Assembler for computing tasks |
No |