Intel® Trace Analyzer and Collector User and Reference Guide
Visible to Intel only — GUID: GUID-963D7A2C-ED18-4099-B34B-D5C860E73EBD
Visible to Intel only — GUID: GUID-963D7A2C-ED18-4099-B34B-D5C860E73EBD
Summary Page
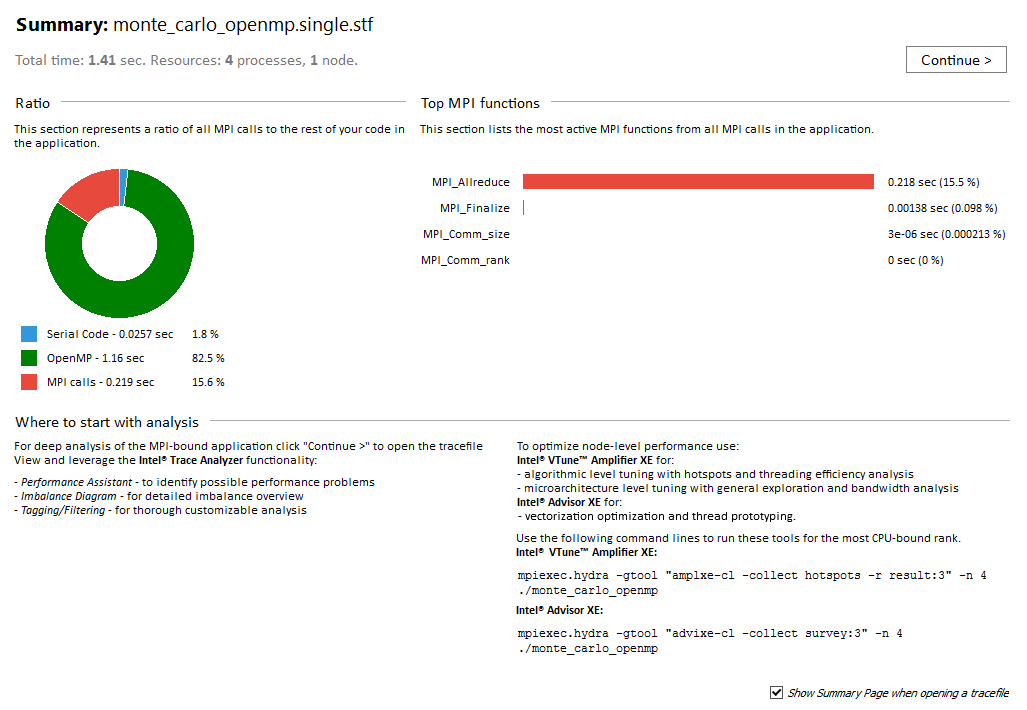
Summary page provides you with summary information on the time your application spent in MPI.
To access the Summary page, go to View > Summary Page, or click the  toolbar button.
If you do not want the Summary page to appear each time you open a new trace file in the Intel® Trace Analyzer, uncheck the Show Summary Page when opening a tracefile check box on the Summary Page or in Options > Preferences > Tracefile Preferences.

Use the Summary page to get the following information:
| Section: | Description: |
|---|---|
| Continue | Open the standard Intel® Trace Analyzer View |
| Ratio | Get the ratio of MPI calls and OpenMP* regions to the rest of your code in the application |
| Top MPI functions | See the most active MPI functions from total MPI in your application |
| Where to start with analysis | Find advice on where to start analysis of communications in the MPI-bound application and where to optimize the application's performance on the node level Get a command line for analyzing the most CPU-bound process with Intel® VTune™ Profiler or Intel® Advisor |
| Show Summary Page when opening a tracefile | Get the Summary Page for each new tracefile that you open |