Intel® Trace Analyzer and Collector User and Reference Guide
Qualitative Timeline
The Qualitative Timeline shows event attributes, such as the data volume of messages, as they occur over time. To open the Qualitative Timeline, select Charts > Qualitative Timeline.
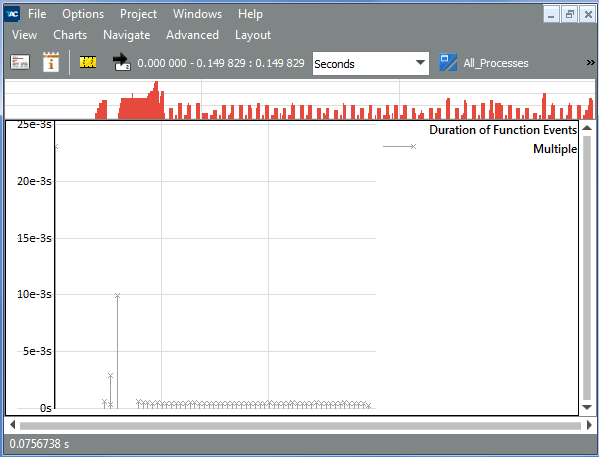
The value of the event attribute is plotted along the vertical (y) axis and time is plotted along the horizontal (x) axis. Select the required event type and attributes from the context menu. Use the Qualitative Timeline to detect patterns and irregular behavior such as extreme deviations or long-term changes in attribute values.
A vertical line in the Qualitative Timeline can represent:
a single event (denoted as Single in the legend)
- several events grouped together (denoted as Multiple in the legend)
For the Poisson example, Qualitative Timeline exposes the pattern of function events. To see it, do the following:
Open the Qualitative Timeline using Charts > Qualitative Timeline.
Right-click on the Qualitative Timeline to display its Context Menu. Select Events to show and then select Function Events.
Zoom into a bunch of iterations.
As a result, you see the staircase pattern that is indicative of your application being serialized:

For more information on detecting and removing serialization in your application, refer to the Tutorial: Detecting and Removing Unnecessary Serialization.