Intel® Trace Analyzer and Collector User and Reference Guide
Visible to Intel only — GUID: GUID-BB70EFED-066E-4BB0-888D-70DA876D5383
Visible to Intel only — GUID: GUID-BB70EFED-066E-4BB0-888D-70DA876D5383
Context Menu
You can access the context menu by right-clicking the Message Profile. Some general context menu options are common to all Charts. Message Profile provides some options that are specific to this timeline.
Specific Message Profile context menu options:
| Entry: | Description: |
|---|---|
| Attribute to show, Columns to show and Rows to show | Select attributes and groupings. These entries are the same as those explained in the Message Profile Settings section. |
| Sort | Sort rows by the values of the column clicked on, or to sort columns by the values in a row clicked on and to switch back to the default order. |
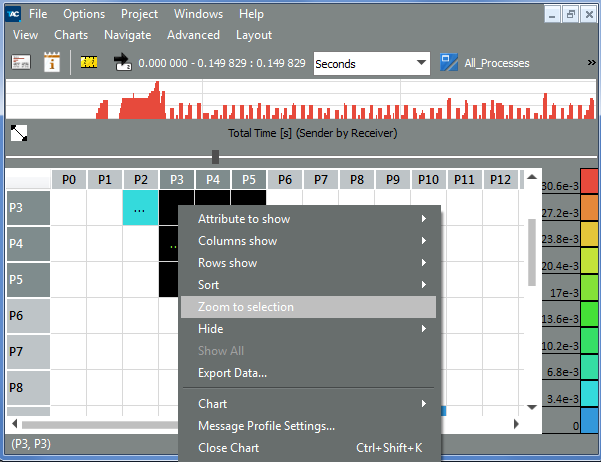
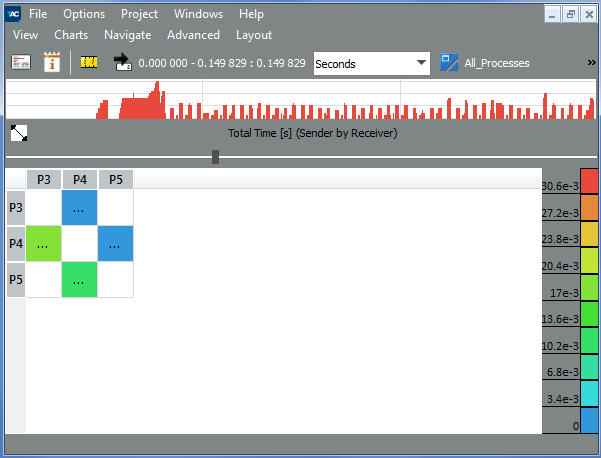
| Use the Zoom to the selection option as shown in the example | See the result. The zoom feature of the Message Profile relies on storing the row and column labels to be suppressed. It can have surprising effects: if Volume is selected as row grouping and the rows with labels 17 and 19 are hidden, then scrolling into an area containing messages with volume 18 results in these messages being shown. To suppress all messages with certain volumes, use filtering. |
| Show All | Show hidden rows and columns |
| Hide | Hide some data |
| Export Data | Open an Export Text dialog box to select a file to store textual data in. It includes all data cells that contain at least one message, even if they are currently hidden. It does not contain row or column statistics. For each cell, it stores all available attributes. |
Zooming to Selected Area in the Message Profile:

Zoomed to the Selected Area:
