Visible to Intel only — GUID: GUID-4D821E26-5B00-4531-A0FA-E7CDC6446169
Visible to Intel only — GUID: GUID-4D821E26-5B00-4531-A0FA-E7CDC6446169
Comparing Two Trace Files
Comparison View calculates the exact differences and speedups between two runs or between two ranges of the same run.
To open a Comparison View for two trace files, open the files and choose View > Compare in one of the trace file views. You can also use the  toolbar button.
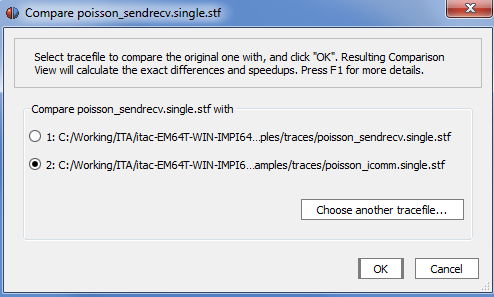
Select the file to compare the selected file with:

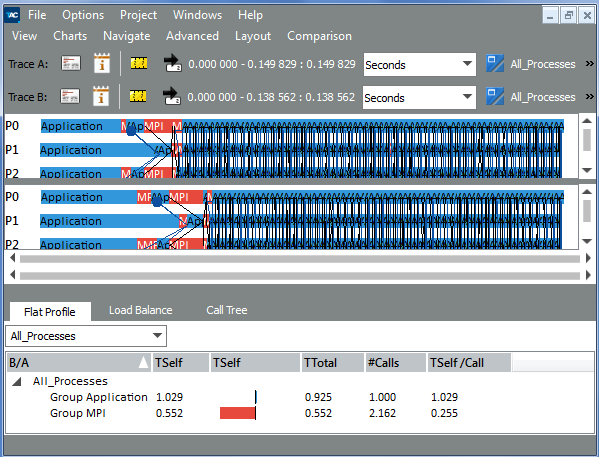
Comparison View appears:

Right below the View menu bar, there are two toolbars with labels Trace A and Trace B. These labels denote two compared trace files.
The Comparison View inherits the time interval, aggregation and filter settings from the compared trace files.
By default, Comparison dialog box consists of three Charts: Event Timelines for Trace A and Trace B and a Comparison Function Profile.
In the view of a single trace file, all charts have the same time interval, aggregation and filters. It refers to the Comparison View Charts as well. But since you compare two trace files, the Comparison View holds two sets of time interval, aggregation and filters, one for each compared trace file.
To compare timelines, use Comparison Charts. The Charts menu of a Comparison Chart contains comparing variants of the profiles that calculate differences and speedups between the two runs. For explanations, see Comparison Charts.
To control the comparison view, go to View Menu > Comparison and configure the settings according to your needs.
| Set This Option: | To Do This: |
|---|---|
| Same Time Scaling | Set this option to use the same scaling for all timelines. For example, when you look at 2 seconds of file A and 4 seconds of file B the timelines for A are shortened so that they occupy half the width of the timelines for B to provide easier visual comparison. If the time intervals for A and B differ by more than a factor of hundred, this setting is ignored and the timelines are aligned as usually to avoid numeric exceptions and distorted diagrams. |
| Synchronize Navigation Keys | This option controls the behavior of the navigation keys in comparison mode. By default, pressing a navigation key affects only the Chart in focus. For example, if the Chart belongs to file A then the time interval changes for file A only. Set this option to configure the navigation keys to affect both of the zoom stacks(for more information, refer to Zoom Stack). |
| Synchronize Mouse Zoom | Set this option to configure the zoom function so that it operates on both timelines simultaneously. |