Intel® Trace Analyzer and Collector User and Reference Guide
Visible to Intel only — GUID: GUID-221FA4EE-038C-41AC-8C53-1FDC6CE870C7
Visible to Intel only — GUID: GUID-221FA4EE-038C-41AC-8C53-1FDC6CE870C7
OpenMP* Regions Display Support
Intel® Trace Analyzer can display information about OpenMP* parallel regions in your application, if this information is present in the trace file. For details on how to record this information into your trace file, see the Recording OpenMP Regions Information.
Information about OpenMP regions is available in the following views:
- Summary Page - displays the percentage of OpenMP time in the application time
- Charts: Event Timeline, Function Profile
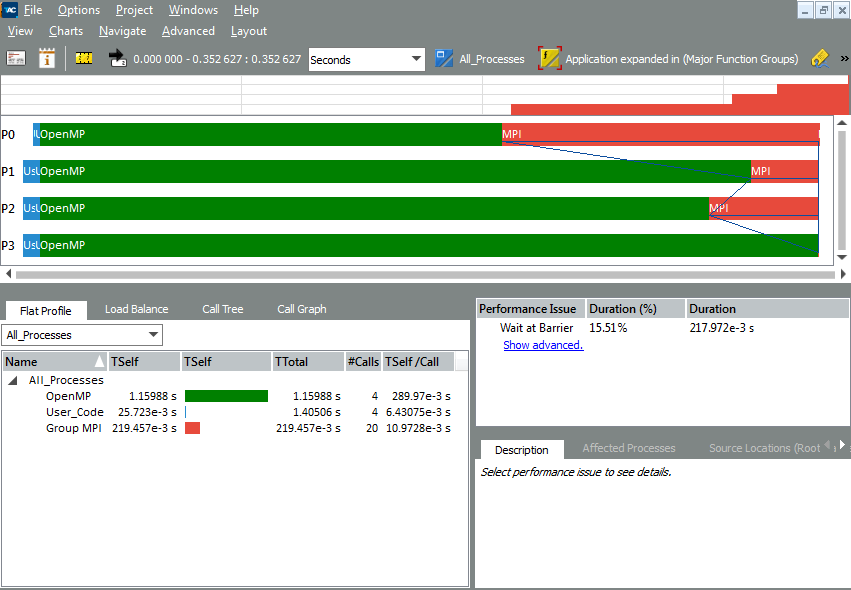
OpenMP regions are part of the application code. Therefore, to see the OpenMP regions in the charts, you should ungroup the Application group. To do so, in one of the charts right-click on Group Application and select Ungroup Application. OpenMP regions are colored green:
