Visible to Intel only — GUID: GUID-BADF0264-3B02-4240-A615-F3AF4243C986
Visible to Intel only — GUID: GUID-BADF0264-3B02-4240-A615-F3AF4243C986
Call Graph
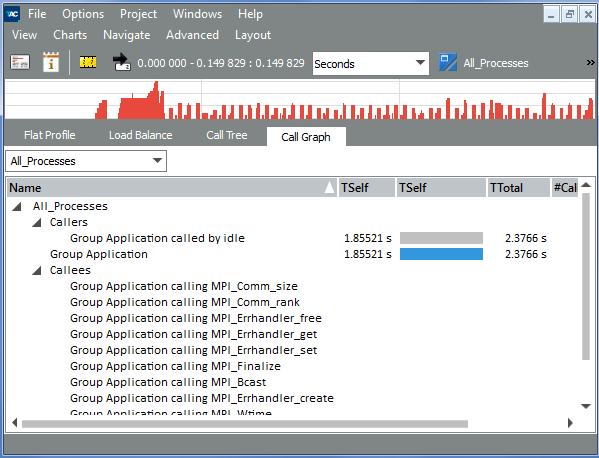
The Call Graph tab shows a small part of the call graph for each process or process group: a single node (called central function) with its inbound and outbound edges. Each process entry has three children: the Callers, the central function, and the Callees.
Navigating through the Call Graph, double-click on a caller or callee and press the space bar or the Enter key to select the respective function as the central node.
The time shown for the central function is the same as shown in the Flat Profile tab and the Load Balance tab. The time shown for the callers represents the time spent in the central function when called from the respective function.
If your application uses a function in different contexts (for example, different algorithms use the function), you can observe which algorithm causes a function to consume more or less time. In the Call Graph, you can see which caller is responsible for most of the time spent in MPI: it is the function group Application (and not Forward, Adjoin, cg, or Smoother). If the call tree gets too big to navigate through, use the Call Graph to find places in the code that cause expensive calls.
