Intel® Trace Analyzer and Collector User and Reference Guide
Visible to Intel only — GUID: GUID-B4C6214A-E994-470E-9B90-CD35D3FF41C7
Visible to Intel only — GUID: GUID-B4C6214A-E994-470E-9B90-CD35D3FF41C7
Detailed Attributes of Function Events
This dialog box provides you with detailed information about function events.
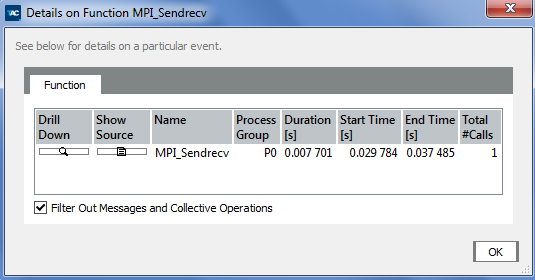
Use the following entries of this dialog box:
| Select This: | To Do This: |
|---|---|
| Name | Specify the name of the selected function. If it represents a Function Group, then it is prefixed with the Group name. |
| Process Group | Specify the Process, Function or Group in which the selected event occurred |
| Duration | Show the time spent in a given Function/Group. For coarser resolutions (Count ≥ 1), the value does not reflect the actual time spent in this function but the length of the time interval over which several function events were merged. |
| Start Time | Show the time when the event entered the Function/Group. For coarser resolutions (Count ≥ 1) the value represents the start of the time interval over which several function events where merged. |
| End Time | Show the time when the event left the Function/Group. On coarser resolutions (Count ≥ 1) the value represents the end of time the interval over which several function events where merged. |
| Total #Calls | Give the total number of function calls. It contains all calls covered by the function in the given time interval, including calls to functions other than the function clicked. If the column Total #Calls shows a value greater than one, the event was created by merging several atomic events. Each entry representing a merged event shows a View, which focuses on the data that went into this entry using the drill down button shown next to the entry. This is called a Detail View; it is a full blown View without restrictions. In the dialog box below the list is a check box that allows you to filter out the other event categories in the Detail View to be opened. |
Sometimes a Function starts before and/or ends after the displayed time interval. In these possible cases, you may see in the Details dialog a less < character preceding the numeric value listed under the column Start Time, and a greater > character preceding the numeric values listed under the columns End Time and Duration. These numeric values are the boundaries of the current zoom interval.