Intel® Trace Analyzer and Collector User and Reference Guide
Visible to Intel only — GUID: GUID-F7D0821D-2F1E-4E2E-B8AA-C3D33581693C
Visible to Intel only — GUID: GUID-F7D0821D-2F1E-4E2E-B8AA-C3D33581693C
Command line for Intel® VTune™ Profiler and Intel® Advisor Dialog Box
Use this dialog box to create a command line for Intel® VTune™ Profiler or Intel® Advisor. See the Interoperability with Intel® VTune™ Profiler and Intel® Advisor section for details.
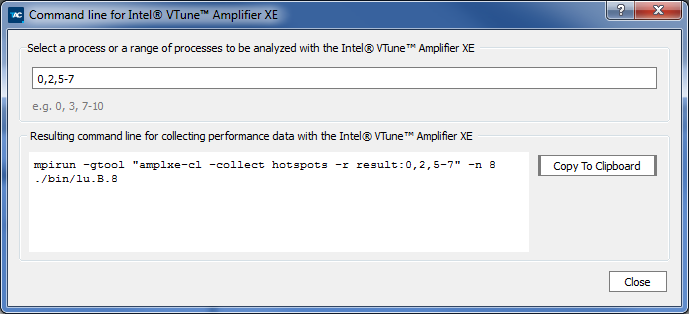
An example dialog box for Intel VTune Profiler may look as follows:

| Select This: | To Do This: |
|---|---|
| Process editing field | Type in the numbers of processes you want to analyze with Intel VTune Profiler/Intel Advisor. You can select single processes separated by comma, or a range of processes separated by a minus sign. For example, to analyze processes 0, 2, 5, 6 and 7 you can type: 0,2,5-7 For full description of the syntax for -gtool, see the Intel® MPI Library documentation. |
| Resulting command line field | Contains the resulting command line, which you can modify according to your needs and use for analyzing the specified processes. For details on the options you can use, see the Intel VTune Profiler/Intel Advisor documentation. When editing this field, the process editing field is unavailable. If your trace file does not contain the original command line, you will see only an example command line. |