Intel® Trace Analyzer and Collector User and Reference Guide
Visible to Intel only — GUID: GUID-8ADEF03E-16C9-41C6-95ED-0906C6777698
Visible to Intel only — GUID: GUID-8ADEF03E-16C9-41C6-95ED-0906C6777698
Load Balance
The Load Balance tab displays the same data as the Flat Profile except that it groups the data by function and not by process. The Load Balance tab compares the profiles of the same function across several processes. The top level entries of the tree given in the first column are functions.
In this figure showing the load balance for MPI_Allreduce, you can see that TSelf for MPI_Allreduce is pretty unbalanced across processes:

| Do This: | To Do This: |
|---|---|
| Right-click on Group MPI and select Ungroup MPI from the context menu | See the distribution of execution time over the individual MPI routines. |
Right-click on the child of Group MPI and select Regroup MPI from the context menu. Or go to Function Aggregation (Advanced > Function Aggregation, or the |
Regroup the children of MPI |
| Select the Children of Group All_Processes entry from the combo box at the top of the tab. | View the data for the children of each process. |
| Press the arrows at the side of each process in the Children of Group All_Processes view | Expand and collapse the processes of interest |
| Right-click on a process and select Command line for VTune Profiler/Advisor... | Open the Command line for Intel® VTune™ Profiler/Intel® Advisor dialog box for selected process |
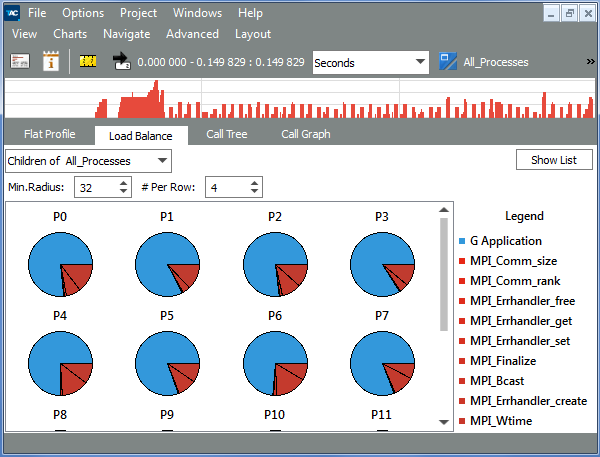
| Switch between the list and pie charts by pressing the button in the top right corner of the tab | Analyze the overall load balance pattern (for TSelf). For example, see the Pie Charts in the Load Balance Tab image. However, there may be a huge number of processes in a relatively confined space. |
| Use two spin buttons above the pie charts | Control the minimum radius of the pies (left button) and how many pie charts appear in a row (right button) |

 toolbar button) and select Major Function Groups