Intel® Trace Analyzer and Collector User and Reference Guide
Charts
Charts in the Intel® Trace Analyzer are graphical or alphanumerical diagrams that are parameterized with a time interval, a process grouping, a function grouping (see Aggregation) and an optional filter. Together they define the structure in which data is presented and the amount of data to be displayed.
The Charts supported by Intel Trace Analyzer are divided into:
Timelines:Event Timeline, Qualitative Timeline, Quantitative Timeline, and Counter Timeline.
Profiles:Function Profile, Message Profile, and Collective Operations Profile.
While the timelines show trace data in graphical form over a horizontal axis representing runtime, the profiles show statistical data. You can show or hide these Charts from the Charts menu on the view menu bar. Charts are grouped into Views. By default, a View contains the Function Profile (showing the Flat Profile tab) when you open a trace file.
Intel Trace Analyzer charts enable you to see the following data:
MPI calls
Application code (includes User Code and OpenMP* regions)
OpenSHMEM* function calls
System calls
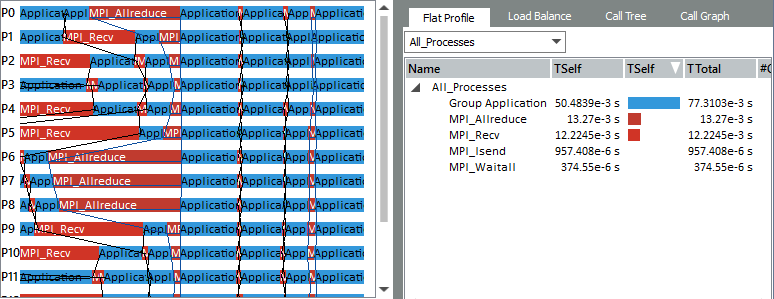
For example, you can see the Application and MPI groups of data on the Event Timeline and the Function Profile:

Ungroup the Application group to see the information about user code and OpenMP parallel regions.
The following sections describe each chart in detail. For each chart there is a subsection about mouse hovering, its context menu, how and why to customize a chart (settings), the effects of filtering, and tagging and the effects of aggregation when applicable.