Visible to Intel only — GUID: GUID-92F186F6-5182-49F0-8577-46D8D9DB9225
Visible to Intel only — GUID: GUID-92F186F6-5182-49F0-8577-46D8D9DB9225
Performance Assistant
Performance Assistant provides you with the general and detailed information about performance problems. You can use this feature either in GUI or in the CLI mode.
To access the tool from the GUI, go to Charts > Performance Assistant or use the  toolbar button. For information on how to use the Performance Assistant in the CLI, refer to the Command Line Interface (CLI) section.
By default, the Performance Assistant does not display all performance problems in your application so as not to slow down the work of the Intel® Trace Analyzer. If you want to get information on all the performance issues, select Show advanced... . Note that this option resets zoom to default. It can also slow down the work of the Intel Trace Analyzer.
Performance Assistant is not supported when the trace file is collected with enabled Correctness Checker or TIME-WINDOWS. In this case, the Performance Assistant displays incorrect data.
See all discovered performance problems and their duration in the upper section of the Performance Assistant. The duration of the problem is displayed in two values - the absolute value and the percentage of the application running time.
Use the lower section of the Performance Assistant to get detailed information on the selected problem. The lower section contains the following tabs:
Description
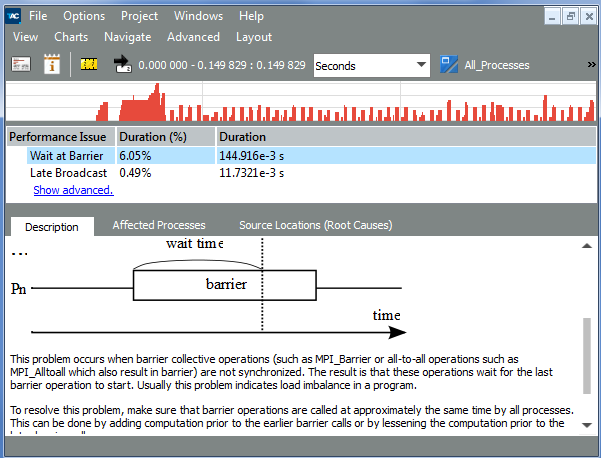
In the Description tab, get the description of the problem and recommendations on how to fix it. For example:

Affected Processes
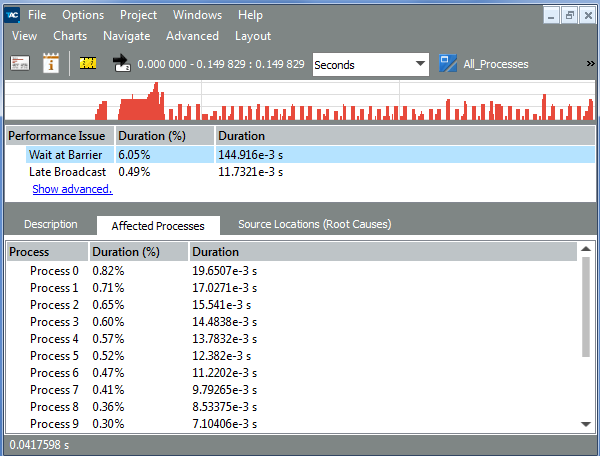
In the Affected Processes tab, see the distribution of the performance problem duration among the processes. For example:

Source Locations (Root Causes)
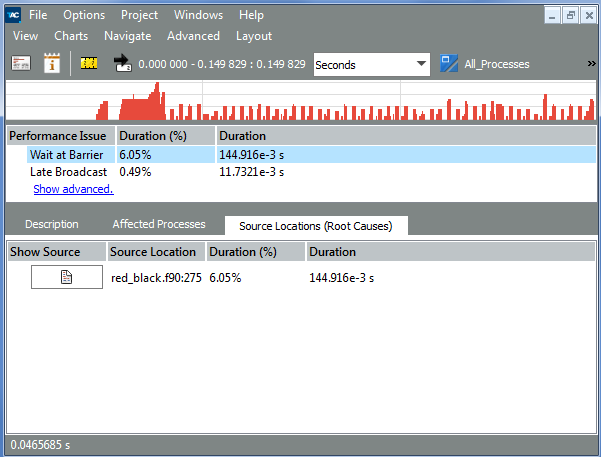
Go to the Source Locations (Root Causes) tab, to get instances of the problem in the source code.
Performance Assistant displays source code only if debug information is present in it and the VT_PCTRACE environment variable is enabled.

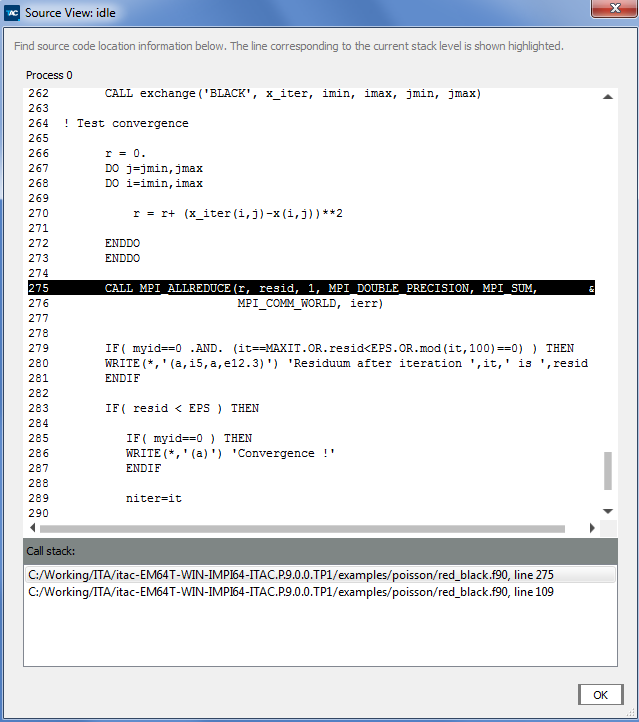
Press the Show Source button to open the Source View dialog box and see the problem-causing calls. Change the highlighted code to fix the problem (get the possible solutions under the Description tab of the Performance Assistant). The Source View dialog box also contains the call stack information.
For example:
