Intel® Trace Analyzer and Collector User and Reference Guide
Visible to Intel only — GUID: GUID-88FD240C-0D8A-4F34-89E8-65ACC6916BB0
Visible to Intel only — GUID: GUID-88FD240C-0D8A-4F34-89E8-65ACC6916BB0
Intel Trace Analyzer Graphical User Interface
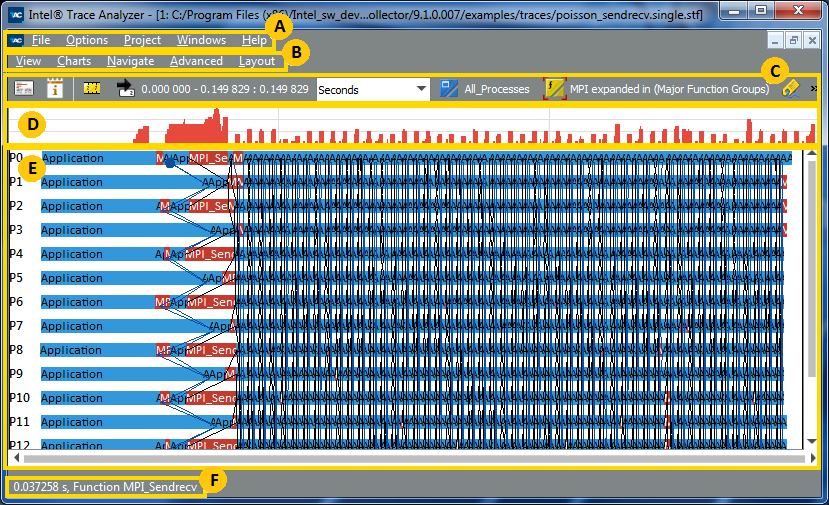
Below is a quick overview of the Intel® Trace Analyzer GUI. For a complete reference of all available charts, bars, and dialogs, see Graphical User Interface Reference. The help information for each GUI element is also available from the tool by pressing the F1 button.

 |
Use the Intel Trace Analyzer and Collector Main Menu Bar to set up your working environment. |
 |
Use the View Menu Bar to configure the opened views. A view is a collection of various charts and their common bars for a single trace file. Use the Charts menu to open and navigate the charts within the current trace file and use them to analyze the application trace data. |
 |
Use the Toolbar buttons to configure the currently open trace file view. |
 |
The Trace Map displays the MPI activity for the application over time. MPI activity is displayed in red, as in all other charts. Use the Trace Map to zoom into the relevant subsets of trace file charts. This map appears for all the charts. |
 |
The currently open and most common chart is the Event Timeline. This chart displays individual process activities over time. Horizontal bars represent the processes with the functions called in these processes. Black lines indicate messages sent between processes and blue lines represent collective operations. To show or hide charts, select Charts. For description of all available charts, see Charts. |
 |
The Status Bar displays the exact time point when you hover the mouse over the processes shown in the Event Timeline. |