Intel® Trace Analyzer and Collector User and Reference Guide
Visible to Intel only — GUID: GUID-4A01B381-C242-472E-A0B0-6E6ACB3B066A
Visible to Intel only — GUID: GUID-4A01B381-C242-472E-A0B0-6E6ACB3B066A
Function Profile Settings
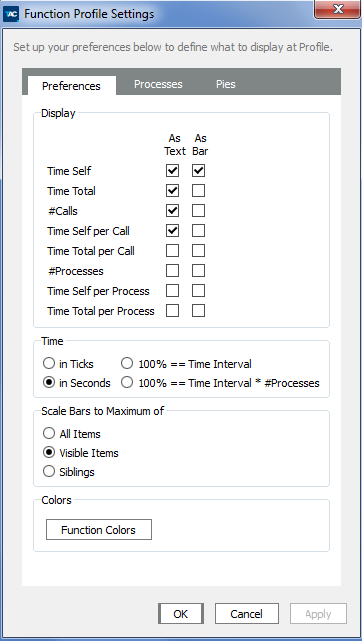
The Function Profile Settings enable you to customize displayed options for all the different views of the Function Profile Chart. To access the Function Profile Settings Preferences, right click on the chart and select Function Profile Settings from the context menu.
Preferences
You can set your Preferences for the display, time, scale bars and colors used in the Function Profile Chart.

| Setting: | Description: |
|---|---|
| Time Self | Display time spent in the given function, excluding time spent in functions called from it. |
| Time Total | Display time spent in the given function, including time spent in functions called from it |
| #Calls | Display the number of calls to this function. If other attributes are non-zero, this attribute can be zero, because the actual calls to the respective function can occur outside the current time interval. |
| Time Self per Call | Display Time Self averaged over #Calls |
| Time Total per Call | Display Time Total averaged over #Calls |
| #Processes | Display the number of processes in this function |
| Time Self per Process | Display Time Self averaged over #Processes |
| Time Total per Process | Display Time Total averaged over #Processes |
| Function Colors | Open the Function Group Color Editor |
Customize how these attributes are displayed using the adjacent setting for text and a bar graph. By default, the following are displayed - Time Self, Time Total, #Calls, and Time Self per Call.
Customize the time format to display as seconds or ticks or as a percentage of the time interval.
Customize the scaling modes are given as radio buttons. They are:
The default Visible Items scales the bars to the respective maximum of all expanded items.
All Items uses the global maximum of all values, regardless of whether they are expanded or not.
Siblings uses only the maximum of the direct siblings.
Processes
If you want particular process to be displayed in the Function Profile:
Navigate to the Processes tab of the Function Profile Settings and choose the necessary processes
Choose the As selected in Settings option
To select all but one process:
Choose the process you do not need
Using the Invert All option to reverse the selection
It does not influence the current process group of the View, but only focuses the Function Profile on a subset of all processes.
Pies
Toggle between the individual diagram titles and the global legend from the Pies control.