Intel® Trace Analyzer and Collector User and Reference Guide
Counter Timeline Settings
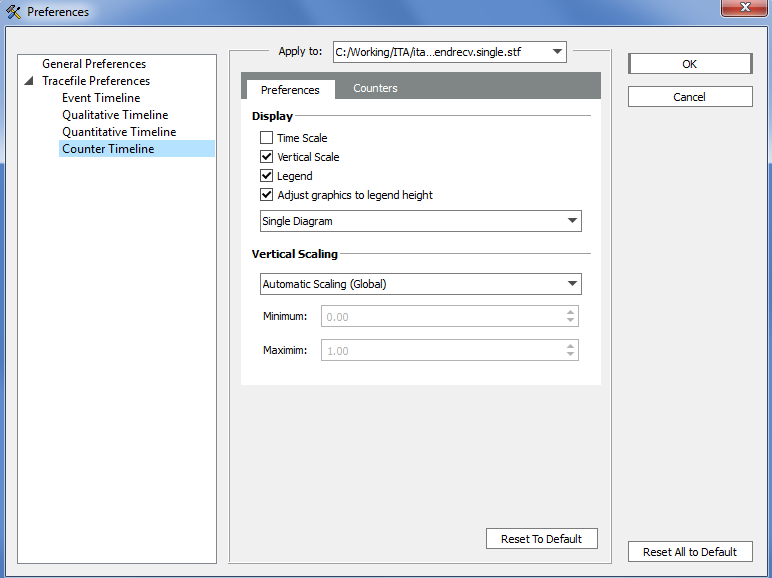
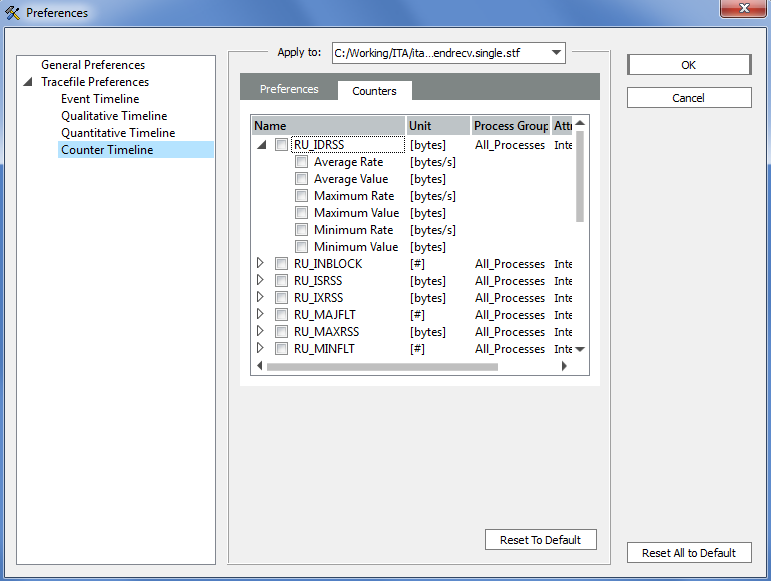
The Counter Timeline Settings provide Preferences and Counters controls.
Preferences
Use these controls to adjust the display settings and the Counter Timeline scaling.

In the Display group, configure the Counter Timeline with the following controls:
| Setting | Impact |
|---|---|
| Time Scale | Display the time scale along the x-axis |
| Vertical Scale | Display the time scale along the y-axis. By default, this option is enabled so that you can see the scale. |
| Legend | Show the legend in the right margin of the timeline. It is also enabled by default. |
| Adjust graphics to legend height | Make the size of the diagram large enough to show all legend items |
| Single Diagram/Many Diagrams combo-box | Select either a single diagram for all selected counters and target group children or a separate diagram for each target group child |
Vertical Scaling offers selection between the Automatic Scaling (per Diagram), Automatic Scaling (Global) and the Manual Scaling of the y-axis. To specify explicitly the minimum and maximum scale values, choose Manual Scaling. When visually comparing two or more Charts in the same or distinct Views, specify the same bounds for all charts.
Counters
There are seven entries for each trace file counter. The top level entry for each counter shows the counter Name, its Unit, the target Process Group, and Attributes. The name and the unit are arbitrary, free-format strings defined in the trace file.

The column Process Group contains the counter target group. A counter that has different values for each process has the target group All_Processes, while a counter that has a distinct value for each SMP node belongs to the target group All_Nodes.
The column Attributes can contain either the Integer or Double attribute, indicating the counter type. And Valid BEFORE Point, Valid AFTER Point, Valid AT Point or Curve attributes to indicate the counter scope. For example, curve indicates that it is meaningful to interpolate values between two given counter values. The attribute Show Rate indicates that it is preferable to display the derivation to time instead of the plain counter values.
Under the top-level counter entry, there are six entries for the minimum, average and maximum values and for the minimum, average and maximum rates, which you can switch on and off independently. If you just check the top-level box with the name of the counter, either the average value or average rate is chosen depending on the counter attributes.