Intel® Trace Analyzer and Collector User and Reference Guide
Visible to Intel only — GUID: GUID-43C77058-BDA0-4E22-A494-85E0ED9A59A1
Visible to Intel only — GUID: GUID-43C77058-BDA0-4E22-A494-85E0ED9A59A1
Message Profile
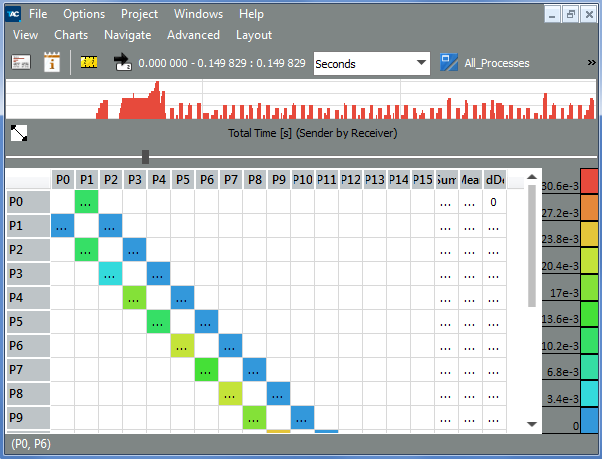
The Message Profile Chart categorizes messages by groupings in a matrix and shows the value of several attributes in each cell.
By default the matrix is square with the sending processes as row labels and the receiving processes as column labels. It shows in cell (i, j) the total time spent in transferring messages from sender i to receiver j.
This chart also includes per row and per column statistics, which give the sum, the average and the standard deviation for the respective row or column.
| Do This: | To Do This: |
|---|---|
| Click on row or column headers | Select rows or columns |
| Keep the mouse button pressed and select the respective cells | Select an arbitrary area of the matrix |
| Right-click and select Zoom to Selection from the context menu | Restrict the display to the selected area |
| Hold down the [Ctrl] key and drag the header to the required position | Change the position of the row and column headers |
| Use the slider above the matrix | Change cell size |
| Right-click and select the Message Profile Settings | Change the grouping that defines the row and column headers of this matrix and therefore the categorization of the data. Available groupings in addition to Sender and Receiver are for example Tag and Communicator. |
| Use the Message Profile Settings | Choose the attribute to be shown in the cells. Apart from the Total Time shown by default there are other time values, transfer rates, volumes, and counts. |
| Press [+] (or [Ctrl]+[+]) | Increase the number of digits locally by three (or one) digits |
| Press [-] (or [Ctrl]+[-]) | Decrease the number of digits |
| Place the mouse over any point in the matrix | See the detailed information for the current position in the View status bar in the form $AttributeValue ($RowLabel, $ColumnLabel). It enables you to get exact attribute values even if the cells are configured to be very small or to show no alphanumerical entries at all. |