Intel® Trace Analyzer and Collector User and Reference Guide
Visible to Intel only — GUID: GUID-19C28A4D-2260-493A-AC49-9ECE4485221C
Visible to Intel only — GUID: GUID-19C28A4D-2260-493A-AC49-9ECE4485221C
Advanced Aggregation
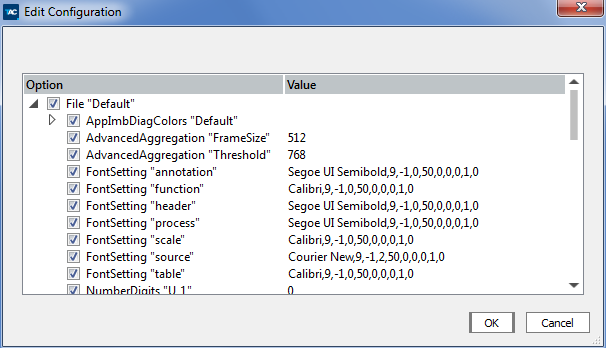
The advanced aggregation function is based on process aggregation and allows lightening the Event Timeline chart for big traces above 1K processes. By default, the function is automatically enabled for traces with above 768 processes, but you can change this threshold using the Edit Configuration Dialog Box.
Advanced Aggregation Settings in the Edit Configuration Dialog:

When you enable this function, all processes are divided into a set of serial groups. Each group has certain count of processes (except for the last one) and corresponds to a single vertical frame on the Event Timeline chart. The default frame size is 512 displayed processes. You can change this value in the Edit Configuration Dialog Box. These processes groups are called All_Processes_(Visible_N1-N2)
N1 is the start of displayed range of processes in the group
N2 is the end of the range
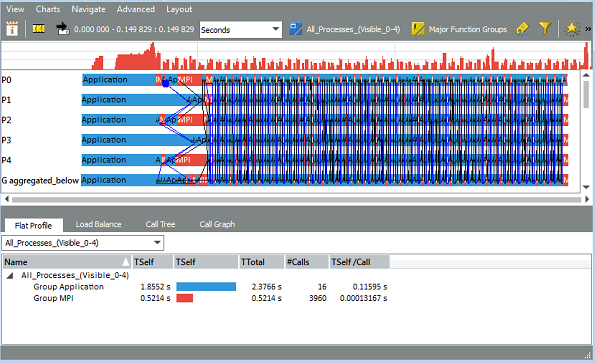
For example, the first advanced aggregation group is called All_Processes by default (Visible_0-4).
The advanced aggregation groups contain hidden (non-visible separately) processes as two additionally aggregated groups:
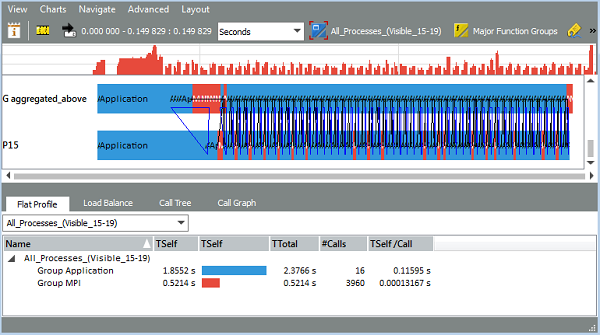
aggregated_above
aggregated_below
They are displayed on the top and on the bottom of a frame respectively.
Bottom of the First Advanced Aggregation Frame:

Top of the Next Advanced Aggregation Frame:

A vertical scrollbar of Event Timeline chart enables you to scroll among all advanced aggregation frames.
When a jump to the next frame happens, Intel Trace Analyzer loads the corresponding process group. The chart may be not available in a short period.