4.4.4.8.3. Performance Counter Example with the Nios® II Command Line
This section describes how to create and run the performance counter software example with the Nios® II command line.
Creating the Performance Counter Software Example
To create the profiler_performance_counter software project in the Nios® II software build flow, follow these steps:
- Open a Nios® II command shell as described in “Creating the Profiler Software Example”.
- Change to the <profiler_software_examples> /app/profiler_performance_counter directory.
- Create and build the application by typing the following command:
./create-this-app
The create-this-app script runs the create-this-bsp script, which reads settings from the parameter_definition.tcl in <profiler_software_examples> /bsp/hal_profiler_performance_counter. This Tcl file contains the following lines:
set_setting hal.sys_clk_timer peripheral_subsystem_sys_clk_timer
set_setting hal.timestamp_timer peripheral_subsystem_high_res_timer
set_setting hal.enable_gprof true
set_setting hal.enable_exit true
The first two lines set the system clock timer and timestamp timer to the corresponding timers in the Platform Designer system.
The third line enables the GNU profiler, and the last line enable the alt_main() function to call exit() following main().
Running the Performance Counter Software Example
To run the application and collect the GNU profiler data, follow these steps:
- Open a second Nios® II command shell.
- In the second shell, open a nios2-terminal session by typing the following command:
nios2-terminal
- In your original Nios® II command shell, run the program by typing the following command:
nios2-download -g *.elf
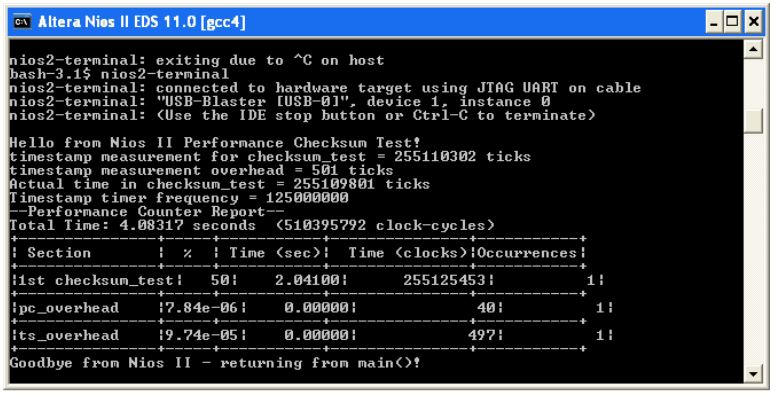
The figure below shows an example of the output that appears in the Nios® II command shell. Your output might vary. For more information, refer to “Analyzing the Performance Counter Report”.
Figure 44. Performance Counter Report on Nios® II Command Shell