Visible to Intel only — GUID: GUID-1205F9BE-F1FB-4F85-B487-37F68079E97B
Visible to Intel only — GUID: GUID-1205F9BE-F1FB-4F85-B487-37F68079E97B
Platform Analysis
The 2025.0 version of Intel® VTune™ Profiler contains the final version of Platform Profiler capabilities, which are available as a standalone downloadable package. No further feature improvements or security fixes will be available after this release. To continue using platform profiling capabilities, use the EMON command line interface. Learn more about this transition in the Intel® VTune™ Profiler - Platform Profiler transition notice.
- To collect platform behavior data using the 2023.2 or newer versions of VTune Profiler, use the standalone Platform Profiler collector. You can then visualize collected data with the Platform Profiler server. You can access this application from the Intel Registration Center. See Platform Analysis for more information.
- The Platform Profiler analysis type is not available in versions of VTune Profiler newer than 2023.2. To use the Platform Profiler analysis type (from the GUI or command line), switch to a version of VTune Profiler older than 2023.2. You can then follow procedures described in Platform Profiler Analysis.
Use Intel® VTune™ Profiler-Platform Profiler to get a holistic view of system behavior. You can then perform system characterization on a deployed system that runs a full load over an extended period of time.
With Intel® VTune™ Profiler-Platform Profiler, you can get insights into these aspects:
- Platform configuration
- Utilization
- Performance
- Imbalances related to compute, memory, storage, IO, and interconnects
You can use Platform Profiler to conduct a coarse-grained, system-level analysis. Use the collected data to triage and characterize your system for a particular workload. This method differs from the System Overview Analysis in some important ways:
Aspect |
System Overview Analysis |
Analysis using Platform Profiler |
|---|---|---|
| Type of analysis | Fine-grained | Coarse-grained |
| Coverage | Hardware and software | Hardware only |
| Type of workload | Light workloads (runtime around a few minutes) | Heavy workloads (runtime running to several hours) |
For heavy workloads with long runtimes, run Platform Profiler to ensure that you use available hardware in the most optimal way.
Platform Profiler consists of a command line data collector and a server implementing a RESTful interface to a time-series database. The collector ships with the VTune Profiler package. You can run Platform Profiler on Windows* and Linux* systems.
Platform Analysis Workflow
Here is the basic workflow to use this application:
- Configure the collector environment.
- Start Platform Profiler.
- After data collection, stop Platform Profiler.
- Import the collected data into Intel® VTune™ Profiler-Platform Profiler server.
- View the collected data.
Configure the Collector Environment
When you configure your environment for the first time, you must have root/Administrator privilege.
To set up your environment, run vpp-collect-vars.
- For a Linux OS, source vpp-collect-vars.sh in the server directory.
$ source /opt/intel/oneapi/vtune/latest/vpp/collect/vpp-collect-vars.sh
- For a Windows OS, run the vpp-collect-vars.cmd script in the server directory.
$ C:\Program Files (x86)\Intel\oneAPI\vtune\latest\vpp\collector\vpp-collect-vars.cmd
Next, create the Platform Profiler server virtual Python* environment. At the command prompt, type:
$ vpp-server-config
Start Platform Profiler
In the command window, type:
$ vpp-collect start -c 'data collection comment'
where the comment argument is optional.
If you want to insert marks in the data metrics timeline, run:
vpp-collect mark 'optional comment'
Stop Platform Profiler
When you have finished collecting data, run this command to stop Platform Profiler:
vpp-collect stop
After data collection completes, Platform Profiler compresses the results into a .tgz (Linux) or .zip (Windows) file whose name contains the name of the target system and a date/time stamp.
Import Collected Data
Next, you import the collected data into Platform Profiler server. Use the Platform Profiler server to examine a performance overview of system behavior. Understand platform-level configuration, utilization and imbalance issues related to compute, memory, storage, IO and interconnects.
To start, set up the environment for Platform Profiler server. When you configure your environment for the first time, you must have root/Administrator privilege.
- For a Linux OS, source vpp-server-vars.sh in the server directory.
$ source /opt/intel/oneapi/vtune/latest/vpp/collect/vpp-server-vars.sh
- For a Windows OS, run the vpp-server-vars.cmd script in the server directory.
$ C:\Program Files (x86)\Intel\oneAPI\vtune\latest\vpp\server\vpp-server-vars.cmd
- For a Linux OS, source vpp-server-vars.sh in the server directory.
Next, create the virtual Python* environment for Platform Profiler server.
vpp-server config
NOTE:You can configure several command line options, if necessary:
Option Purpose --webserver-port PORT Change the default port (originally 6543) on which the Platform Profiler web server listens for connections.
--database-port PORT Change the default port (originally 8086) on which the database server of the Platform Profiler listens for connections.
--data-dir PATH Change the default directory where the Platform Profiler data is stored.
--reset-passphrase Display the server password prompt so that it can be changed.
--quiet Silence all prompts and accept the default data directory.
Start the Platform Profiler server using default settings. Run this command:
vpp-server start
In the Server Settings dialog box, specify a directory for storage and/or authentication if necessary.
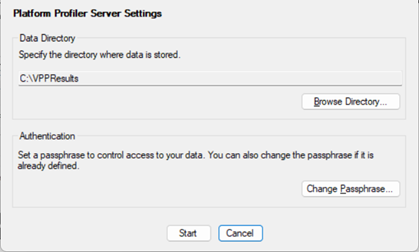
Open a web browser to the address and port number of the server instance of Intel® VTune™ Profiler-Platform Profiler. For example, in the address bar of the web browser, type:
localhost:6543
Enter your passphrase for the database and click Login. You can also create a new folder to store the imported results and then click on the folder name to open it.
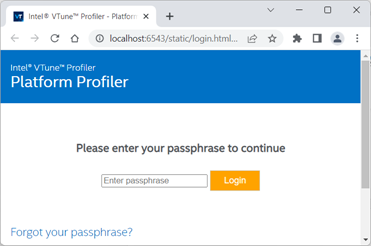
Once you log in, go to the View Results tab and click the Upload button.
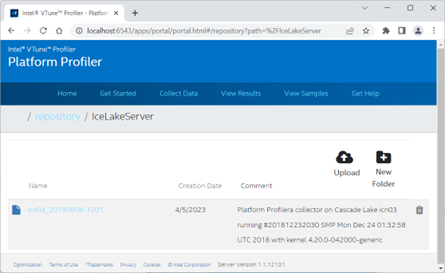
After the data import completes, you can view results by clicking on the results name.
View Collected Data
After data collection and import, VTune Profiler server displays information in three areas:
- The Platform Configuration Diagram - Use this diagram to get quick metrics for each subsystem (socket, core, memory, disk, etc.).
- An interactive timeline - Filter on a smaller range of collection time.
- Detailed performance charts
Start with the platform configuration diagram to see configuration details and key metrics. Hover over component icons to see additional details for a component.
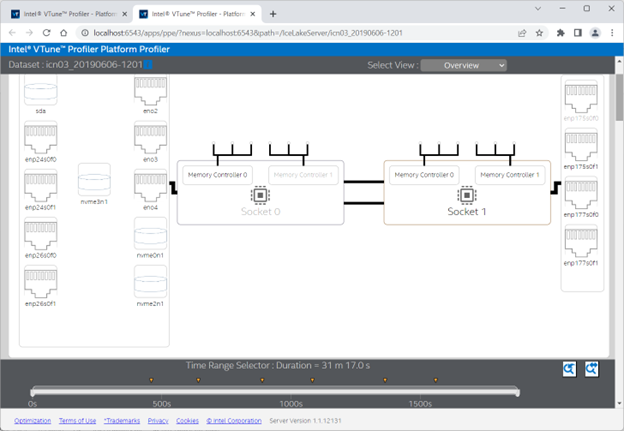
There are several views to help you visualize and interpret the collected data. A good starting point is the Overview, which you can select from the Select View pulldown menu.
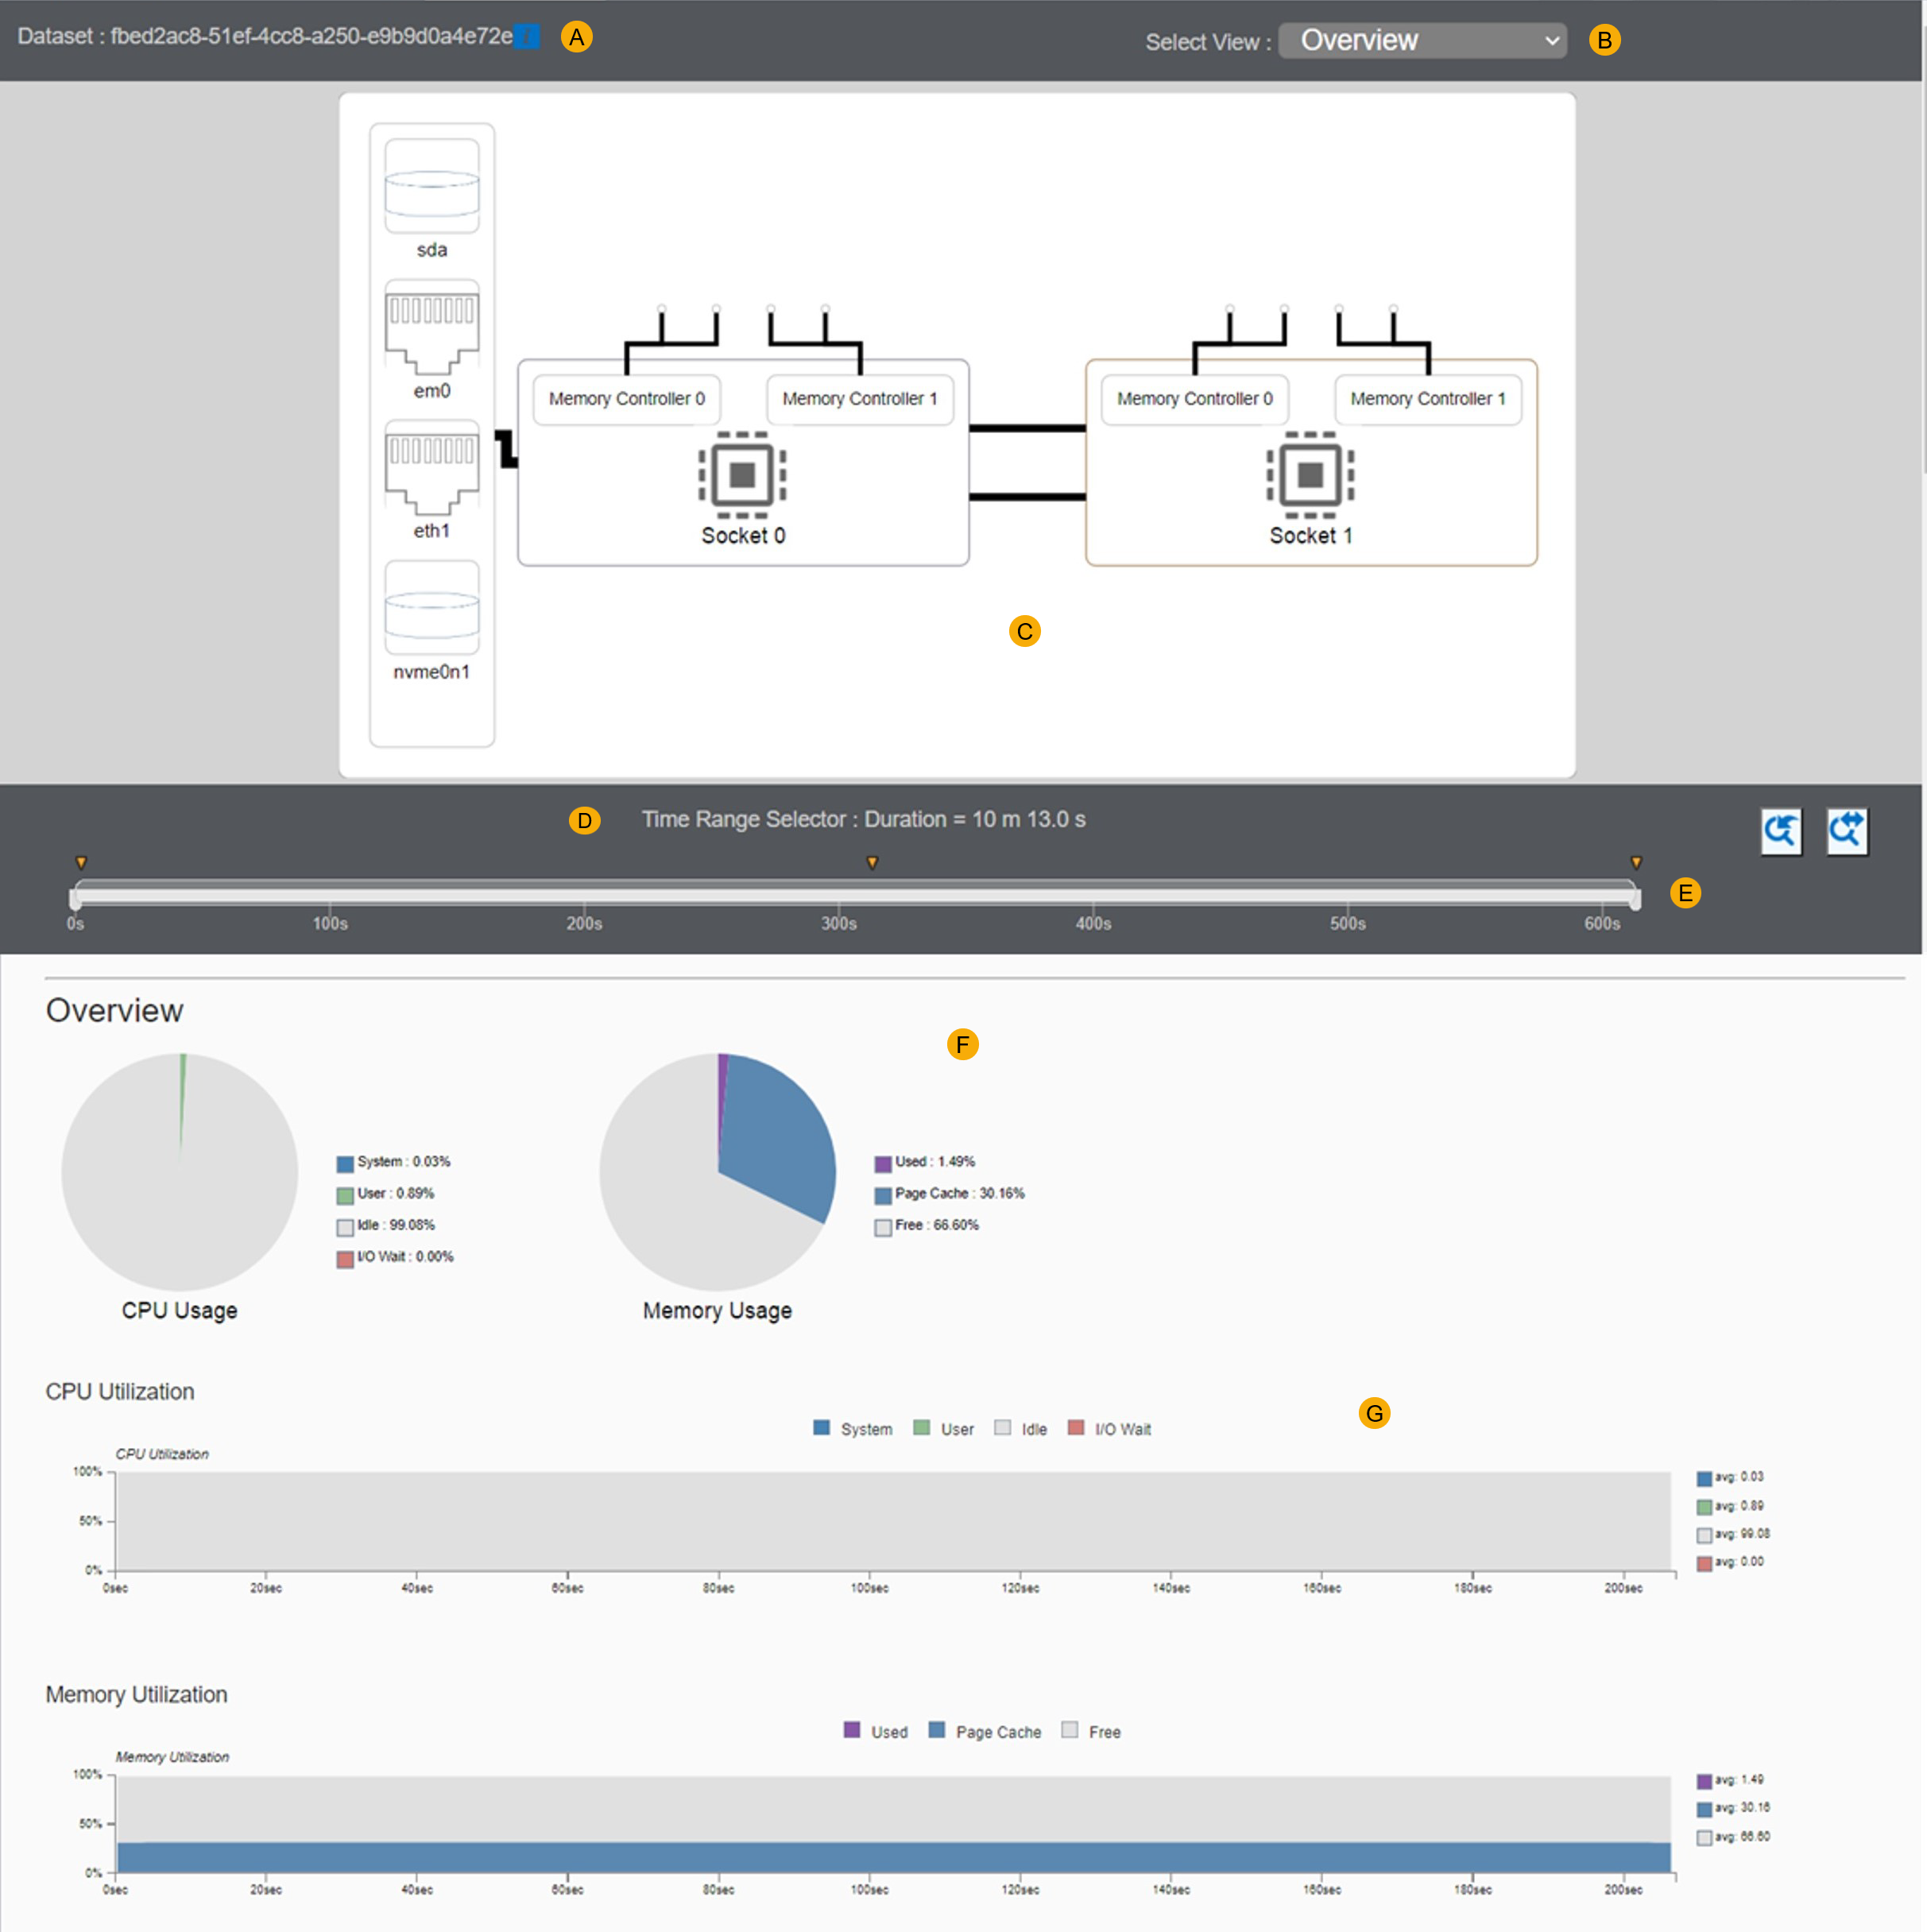
 |
Hover over here to see information about the system used for data collection. |
 |
See different views for information on sockets, cores, memory, and storage devices. |
 |
Hover over here to see additional information about the platform configuration. Click on specific elements to switch views. |
 |
Filter the data for a specific time range. |
 |
Undo or reset a zoom level. |
 |
See summary information about CPU and memory utilization. |
 |
See performance information over time. Click and drag to select and zoom into a specific time range. |
Next Steps
Consider whether an upgrade to hardware components (CPU, memory, storage, network) could improve performance. After you install new hardware, repeat the platform analysis and compare performance between the older and newer components.
Analyze the collected data to determine the most prevalent performance bottlenecks and the most impacted components. If a specific portion of the workload is causing performance issues, consider running the following analysis types using VTune Profiler using a targeted collection interval (seconds instead of hours):
Microarchitecture Exploration: Identify issues with CPU utilization, cache, or memory
Memory Access: Identify memory issues
Input and Output: Identify storage usage issues