A newer version of this document is available. Customers should click here to go to the newest version.
Manage Timeline View
Understand how you can filter, sort, and group data in the Timeline pane in Intel® VTune™ Profiler.
To Do This |
Use This |
|---|---|
Group the data by program units |
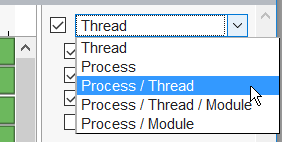
Use the Timeline grouping menu to select a grouping level:
A grouping level depends on the analysis type. Selected grouping affects the metrics provided in the Timeline pane. If some of the metrics are not supported for the selected grouping, this data does not show up in the Timeline view and the legend is updated accordingly. |
Sort the data |
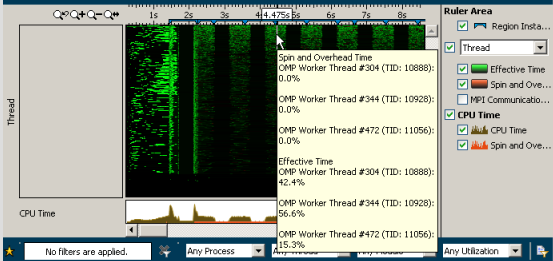
Right-click the list of threads/cores/CPUs (depending on the analysis type) and select the required type of sorting from the Sort By content menu option:
|
Re-order the rows |
Select the row. Hold and drag it to the required position. Press SHIFT to select multiple adjacent rows. Press CTRL to select multiple disjointed rows. |
Filter data |
Select the required program unit(s). Right-click and choose from the context menu to filter in or filter out the data in the view by the selected items. To return to the default view, select the Remove All Filters option. |
Zoom in and focus on a particular graph section |
To restore the timeline to the previous state, right-click and select Undo Previous Zoom. To restore the timeline to the entire time interval (for example, after multiple zooming operations), right-click and select Reset Zoom from the context menu or click the |
Zoom in/Zoom out of the timeline |
Click the |
Change the height of the row |
Right-click and select the Change row height option from the Timeline context menu and select the required mode:
|
Change the measurement units on the time scale |
Right-click, select the Show Time Scale As context menu option, and choose from the following values:
|
Open the source view |
Double-click the required transition/wait. VTune Profiler opens the Source or, if symbol information is not available, Assembly pane and highlights the corresponding waiting/signaling call site. |
Synchronize the selection with other panes |
Select a thread/module of your interest. VTune Profiler automatically highlights the program units (for example, functions) corresponding to the selected item in the Bottom-up and Top-down Tree panes. |

 Reset Zoom button on the timeline toolbar.
  Zoom In/
  Zoom Out buttons on the timeline toolbar.

