A newer version of this document is available. Customers should click here to go to the newest version.
Tuning Methodology
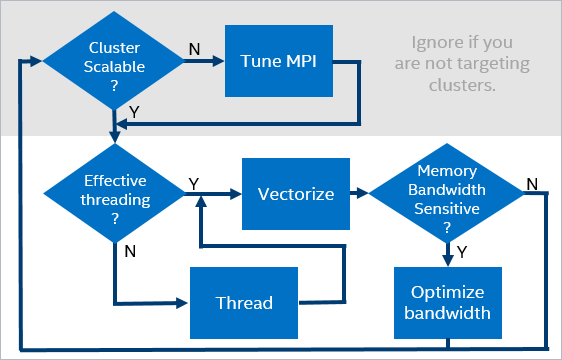
When you optimize code for parallel hardware, use this iterative approach:

If you are not running code on a cluster, focus on the lower portion of the diagram. Since different applications may have different priorities, there is no unique starting point for this iterative process. Start optimizing where you get the most benefit from making changes.
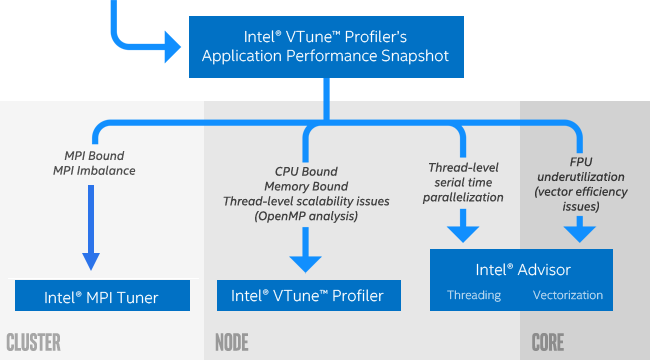
For an overall assessment of focus areas for performance optimization, run Application Performance Snapshot. Then, depending on your target, use one of these tools for deeper performance analysis.
- Profile clusters with Intel MPI® Tuner
- Profile nodes with Intel® VTune™ Profiler
- Examine threading and vectorization in nodes and cores with Intel® Advisor.

To learn more about performance tuning with VTune Profiler, use these resources:
Profiling Scenarios for managed code and applications using Intel® runtime libraries