A newer version of this document is available. Customers should click here to go to the newest version.
Energy Analysis
Use Intel® SoC Watch and Intel® VTune™ Profiler to collect and analyze power and energy consumption metrics. You can collect data on Windows, Linux, or Android systems. Use this data to identify system behaviors that waste energy.
Get Snapshot through Intel® VTune™ Profiler
In the snapshot view, you can observe package power consumption over time when you run any analysis type in Intel® VTune™ Profiler. This option is available when you run VTune Profiler on Windows, Linux, or Android systems.
- On the VTune Profiler welcome screen, click Configure Analysis.
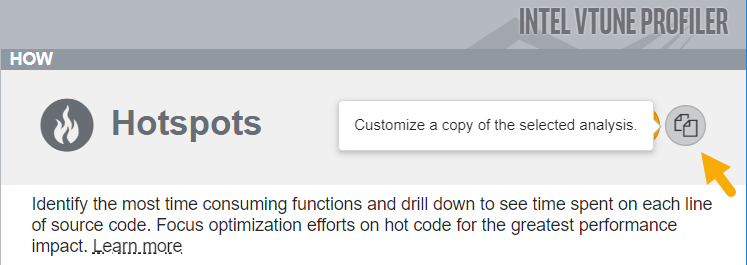
- In the HOW pane, select an analysis type. In this example, we use the Hotspots analysis.
- Customize a copy of the analysis. Click this icon:

- Select options as necessary.
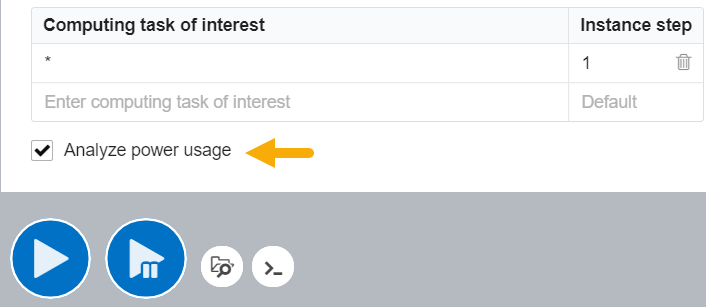
- At the bottom of the analysis type, check Analyze power usage.

- Click Start(
 ) to run the analysis.
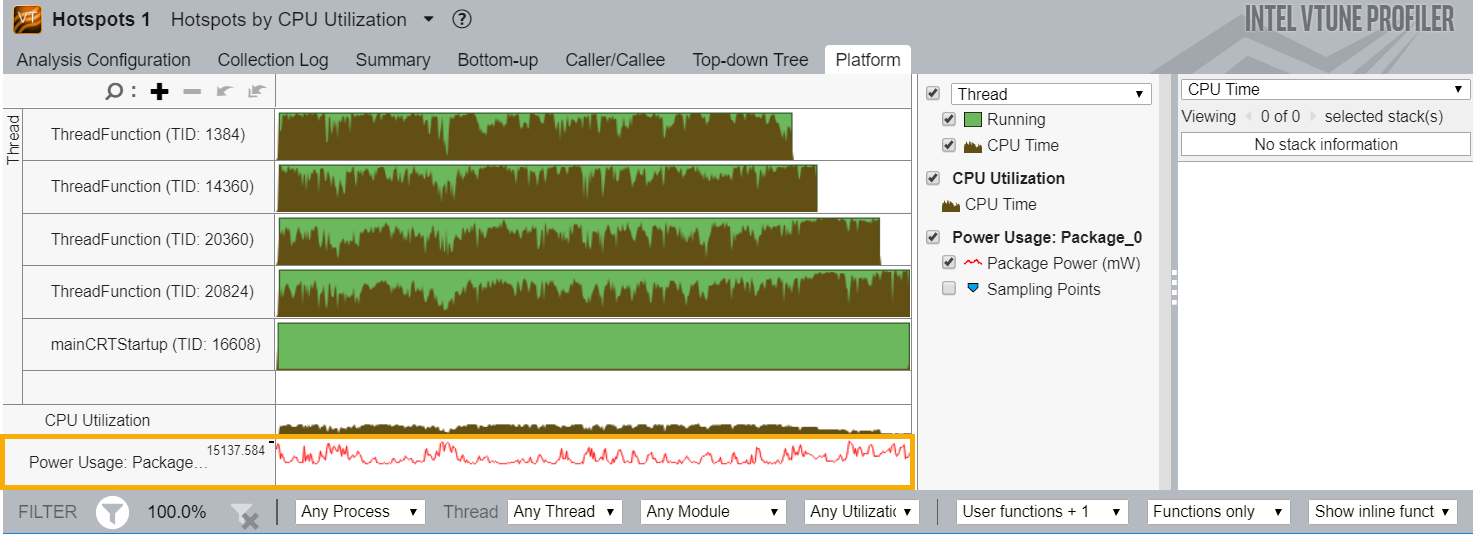
When the analysis completes, VTune Profiler displays package power usage information (collected by Intel® SoC Watch) in the Platform tab.

Track package power usage to see if the CPU is likely to enter a throttling phase.
For detailed information about using Intel SoC Watch, see the Energy Analysis User Guide.