A newer version of this document is available. Customers should click here to go to the newest version.
Window: Flame Graph
Use the Flame Graph window to find the hottest code paths in your application.
A flame graph is a visual representation of the stacks and stack frames in your application. The graph plots all of the functions in your application on the X-axis and displays the stack depth on the Y-axis. Functions are stacked in order of ancestry, with parent functions directly below child functions. The width of a function displayed in the graph is an indication of the amount of time it engaged the CPU. Therefore, the hottest functions in your application occupy the widest portions on the flame graph.
Access the Flame Graph Window
- Run the Hotspots analysis on your application. Ensure that you are collecting data with call stacks.
- If you are running the analysis in User-Mode Sampling mode, the option to collect CPU sampling data with stacks is enabled by default (see Details).
- If you are running the analysis in Hardware Event-Based Sampling mode, check the Collect Stacks option.
- When the analysis is complete and results display, switch to the Flame Graph tab. You can also click on the Flame Graph link in the Insight section of the Summary window.
Elements of the Flame Graph Window

-
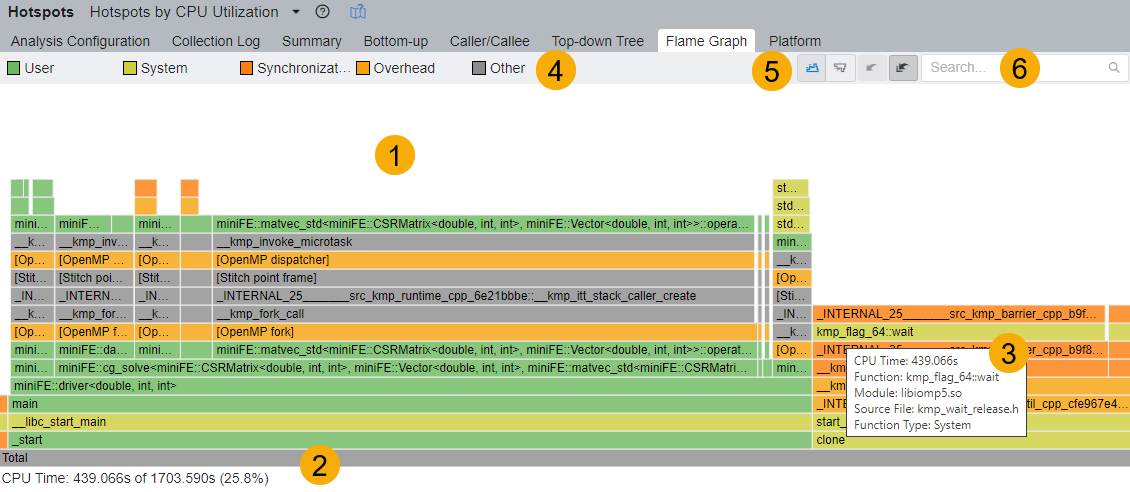
 Number 1
-
Flame Graph Area:
This section displays stacks and stack frames for your application. Every box in the graph represents a stack frame with the complete function name. The horizontal axis shows the stack profile population, sorted alphabetically. The vertical axis shows the stack depth, starting from zero at the bottom.
The flame graph does not display data over time. The width of each box in the graph indicates the percentage of the function CPU time to total CPU time. The total function time includes processing times of the function and all of its children (callees).
The flame graph is a graphical representation of the data contained in the tabular Top-Down view.
- Zoom/Select Action: To learn more about a function, click on a box to zoom in horizontally. You will then see any child functions it contains. Ancestor frames (below the selected box) display in faded colors because their width is only partially visible. Changes in stack pane data reflect any zoom or selection action you take in the flame graph area.
- Filter toolbar: The flame graph responds to changes to the Global Filter setting in the Filter toolbar. Use this toolbar to filter data in the following ways:
- Process
- Thread
- Module
- Function Type
- Time
- Function colors: The flame graph uses a color scheme to identify these function types:
- User: A function from the application module of the user
- System: A function from the System or Kernel module
- Synchronization: A synchronization function from the Threading Library (like OpenMP Barrier)
- Overhead: An overhead function from the Threading library (lke OpenMP Fork or OpenMP Dispatcher)
-

-
Details Area:
Hover over a flame graph element to get CPU Time as well as the percentage of Total Time taken by the selected stack-frame.
-

-
Tooltips:
When you hover over a flame graph element, a tool tip displays these details for the selected bar or stack frame:
- CPU Time
- Function name
- Module name
- Source file
- Function type
-

-
Legend:
The legend describes the types of functions included in the flame graph.
-

-
Navigation Bar:
Use these controls in the navigation bar to manage the flame graph display:

 : Select the Flame Graph mode.
  : Select the Icicle Graph mode. This inverts the flame graph display.
  : Undo the last zoom action.
  : Restore the flame graph to its original view.
-

-
Search:
Search for any functions in the flame graph. You can use regular expressions in the search string. When the results display, the CPU Time and percentage of Total Time include the times for all of the matched functions.

Analyze Flame Graph Data
Use these tips to analyze the application information contained in your flame graph:
- For hot code paths in your application, analyze the time spent on each function and its callees. The function bar displays as a fraction of CPU time.
- Choose between the Flame Graph and Icicle Graph visualizations to help with your analysis.
- Filter data through the Filter bar and/or Timeline.
- Optimize your application starting with the lowest function in the flame graph and working your way up.
- Pay close attention to the hottest user and synchronization functions. In the flame graph, they appear as the widest functions.
- Use the stack pane to dive into the source code of a function.