A newer version of this document is available. Customers should click here to go to the newest version.
Visible to Intel only — GUID: GUID-28F5E1F5-DF89-4A18-A74D-BEFB3482C42F
Visible to Intel only — GUID: GUID-28F5E1F5-DF89-4A18-A74D-BEFB3482C42F
Set Up Remote Linux* Target
Use Intel® VTune™ Profiler on a Windows* or Linux* host system to analyze code performance on remote Linux systems.
To analyze applications on a remote Linux target (regular or embedded systems), you can run VTune Profiler:
Using Remote CLI (vtune) or GUI (vtune-gui) - This is the recommended method for regular and embedded systems.
Using the Native CLI - Install and run VTune Profiler directly on a remote Linux system.
Using Native SEP with sep - This is the recommended method for tiny embedded systems.
Use Remote CLI or GUI
Minimum disk space needed on the target system: ~25 MB
This mode is recommended for most cross-development scenarios supported by the VTune Profiler, especially if your target system is resource-constrained (insufficient disk space, memory, or CPU power) or if you use a highly customized Linux target system.
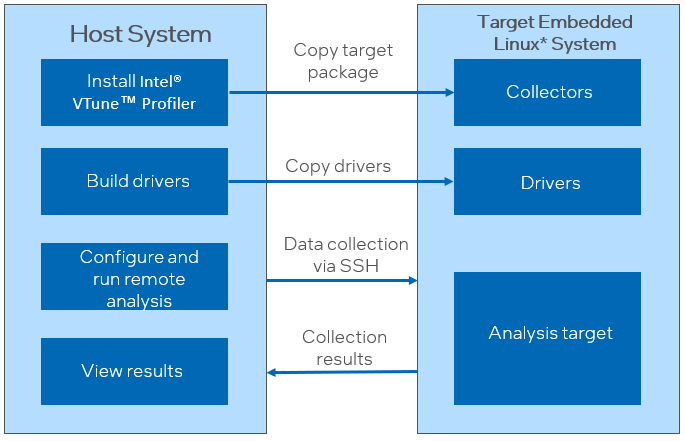
To collect data on a remote Linux system:

1. Install VTune Profiler |
Install the full-scale VTune Profiler product on the host system. |
|
|
3. Configure and run remote analysis |
VTune Profiler runs your application on the target and collects profiling data. When the analysis is completed, VTune Profilercopies the results and binary files to the host system and finalizes the data. You can also run this data collection from the command line. |
4. View results |
View the collected data on the host. You can also import results from a previous data collection. |
Use the Native CLI
Minimum disk space needed on the target system: ~200 MB disk space.
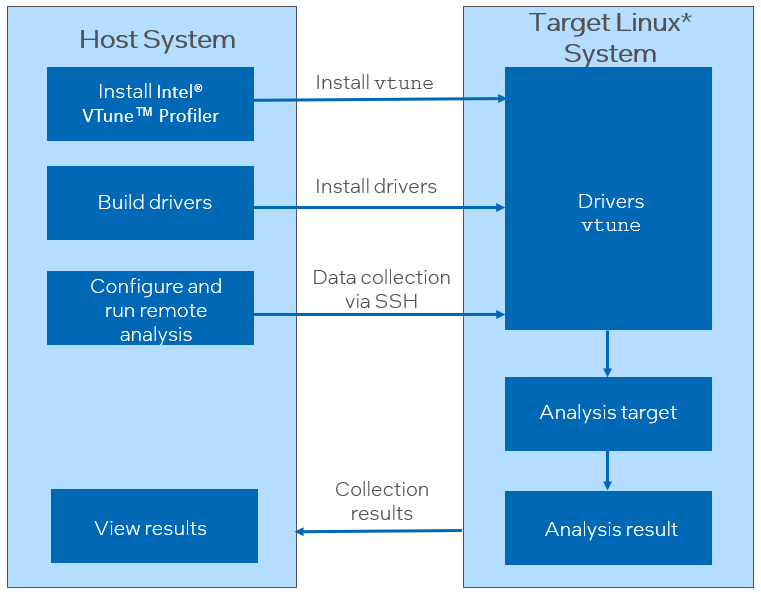
Use this mode to profile applications on regular Linux target systems. In this mode, you install the full-scale VTune Profiler product on a host system. You install the command line interface of VTune Profiler, vtune on the target system. You can then run native data collection directly on the target.
This figure shows an overview of the remote analysis that is run with vtune directly on the target system:

In the native usage mode, workflow steps to configure and run analysis on a remote system are similar to the remote collectors mode.
Use Native Sampling Collector (SEP)
The Sampling collector (SEP) is a command-line tool for hardware event-based sampling analysis that you can use for resource-restricted systems. SEP is a part of the VTune Profiler package. The SEP package contains both sep utilities and the sepdk source code (for pax.ko and sep4_x.ko) which are necessary to build the sampling drivers.
To use SEP,
- Extract the SEP package from the vtune_profiler_target_sep_x86.tgz or vtune_profiler_target_sep_x86_64.tgz file.
- Build the driver.
- Upload the driver and sep utilities to the target.
- Use the command line to collect the event-based sampling performance data.
You can find more information in the Sampling Enabling Product User's Guide.
VTune Profiler also provides the sepdk sources for building sampling drivers. If VTune Profiler uses the same driver as SEP, the source code for sepdk may be identical to the source code provided in the SEP package. VTune Profilersepdk sources also include the event-based stack sampling data collector that is not part of the SEP package.