Visible to Intel only — GUID: GUID-9DF6900B-D350-4916-BB27-72912FA29517
Visible to Intel only — GUID: GUID-9DF6900B-D350-4916-BB27-72912FA29517
Examples of CSV Format and Imported Data
Explore examples of the performance data gathered with an external collector and imported into an Intel® VTune™ Profiler project in the CSV format.
Examples for importing interval data:
Examples for importing discrete data:
Examples for Importing Interval Data
Example 1: CSV File with the Performance Counter Timestamp
name,start_tsc.QPC,end_tsc,pid,tid
frame1,2,30,,
frame1,33,59,,
taskType1,3,43,1,1
taskType2,5,33,1,1
taskType1,46,59,1,1
taskType2,45,54,1,1
VTune Profiler will process data with missing PID and TID as frames. Data with the PID and TID specified will be processed as tasks.
Example 2: CSV File with the System Counter Timestamp
name,start_tsc.UTC,end_tsc,pid,tid
Frame1,2013-08-28 01:02:03.0004,2013-08-28 01:02:03.0005,,
Task,2013-08-28 01:02:03.0004,2013-08-28 01:02:03.0005,1234,1235
Example 3: CSV File with Interval Data Bound to a Process
name,start_tsc.TSC,end_tsc,pid,tid
function1_task_type,419280823342846,419280876920231,12832,11644
function2_task_type,419280876920231,419281044717992,12832,11644
function1_task_type,419281044745822,419281102121452,12832,11644
function2_task_type,419281102121452,419281277898762,12832,11644
function1_task_type,419281277935812,419281342158661,12832,11644
function2_task_type,419281342158661,419281527040239,12832,11644
VTune Profiler processes this data as tasks (TID and PID values are specified) and displays the result in the Platform window as follows:

Example 4: Command Line Report for Imported Interval Data Bound to a Process
In this example, the hotspots report shows counters bound to a specific process/thread grouped by tasks:
vtune -R hotspots -group-by=task -r my_result
vtune: Using result path 'my_result'
vtune: Executing actions 50 % Generating a report
Task Type           CPU Time:Self  Task Time:Self  Overhead Time:Self  Spin Time:Self  Thread Counter:victim_counter:Self  Thread Counter:victim_counter_x2:Self
------------------  -------------  --------------  ------------------  --------------  ---------------------------         ---------------------------------
[Outside any task]              0               0                   0               0                            0         2
ITT Task                        0           0.009                   0               0                            2         6
victim_task                     0           0.000                   0               0                            0         0
vtune: Executing actions 100 % done
Example 5: Interval Data Not Bound to a Particular Process
name,start_tsc.TSC,end_tsc,pid,tid
calibrating_frame,419743756747826,419747241283878,,
open_file_frame,419747251423510,419747504506086,,
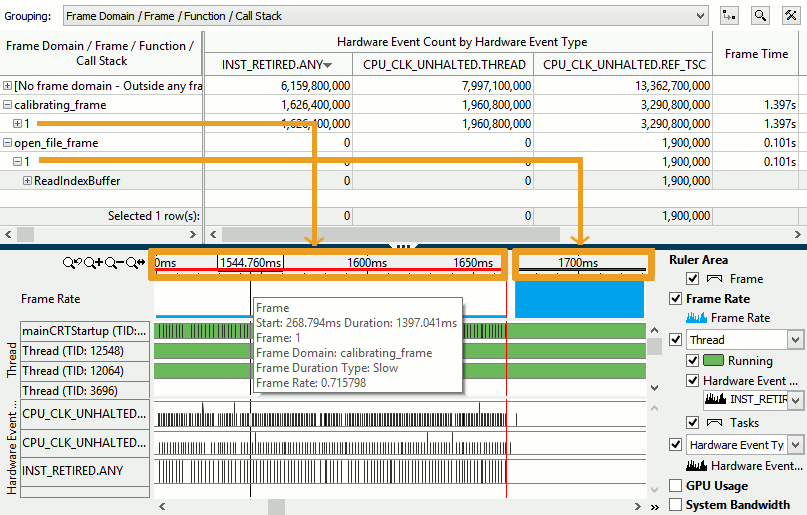
VTune Profiler processes this data as frames (there are no TID and PID values specified) and displays the result as follows:

With the VTune Profiler, you can easily correlate the frame data in the Timeline pane and grid view.
Example 6: Command Line Report for Imported Interval Data Not Bound to a Process
In this example, the hotspots report shows counters not bound to a specific thread/process grouped by frame domain:
vtune -R hotspots -group-by=frame-domain -r my_result
vtune: Using result path 'my_result'
vtune: Executing actions 50 % Generating a report
Frame Domain     Frame Time:Self  Counter:global_counter:Self  Counter:global_counter_x2:Self
------------     ---------------  ---------------------------  -----------------------------
cuscol_frame     0.126            4                            8
cuscol_utc_frame 0.126            4                            8
vtune: Executing actions 100 % done
Examples for Importing Discrete Data
Example 1: CSV File with the Performance Counter Timestamp
tsc.QPC,MyCounter1.COUNT,MyCounter2.INST,pid,tid
2,1,3,1,1
5,2,5,1,1
10,3,3,1,1
23,10,7,1,1
Example 2: CSV File with the System Counter Timestamp
tsc.UTC,MyCounter1.COUNT,MyCounter2.COUNT,pid,tid
2013-08-28 01:02:03.0004,1234,,1234,1235
2013-08-28 01:02:03.0005,1234,,1234,1235
 2013-08-28 01:02:03.0006,,1000234,,
Example 3: CSV File with Discrete Data Not Bound to a Particular Process
tsc.TSC,global_inst_val1.INST,global_counterWIV.COUNT,pid,tid
78912463824135,3,6,,
78916553573577,6,9,,
78919519641325,3,12,,
78922574591880,6,18,,
78925599513489,3,21,,
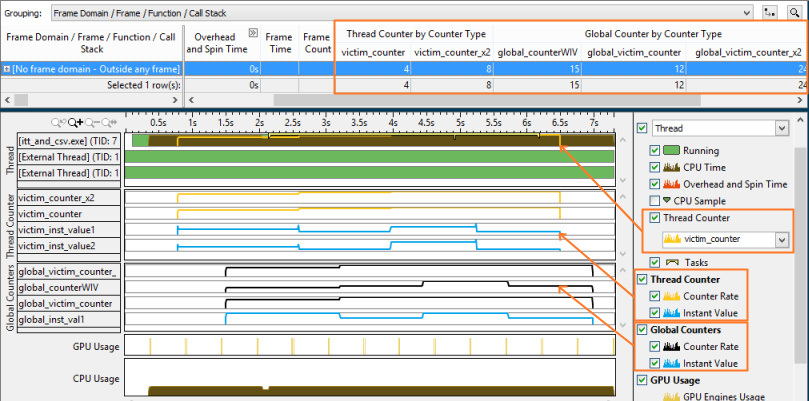
VTune Profiler processes this data and displays the result as follows:

Discrete cumulative counter values, both thread-specific and global (not thread-specific), are provided in the grid view and in the Timeline pane in yellow. Instantaneous counter values, thread-specific and global, are displayed in blue in the Timeline pane only.
To view global counter values in the grid, make sure to select a generic (not thread specific) grouping level like Frame Domain/Frame/Function/Call Stack.
Example 4: Command Line Report for Imported Discrete Data
This example provides the hw-events report with external discrete data (counters) integrated into a VTune Profiler hardware event-based sampling analysis result cl_result.vtune:
vtune -R hw-events -group-by=process -r my_result
vtune: Using result path 'my_result'
vtune: Executing actions 50 % Generating a report
Process          Counter:victim_counter:Self  Counter:victim_counter_x2:Self
---------------  ---------------------------  ------------------------------
itt_and_csv.exe                            2                               4
vtune: Executing actions 100 % done