A newer version of this document is available. Customers should click here to go to the newest version.
Visible to Intel only — GUID: GUID-89CBE1E7-E20A-4627-92D3-FBA54C815689
Visible to Intel only — GUID: GUID-89CBE1E7-E20A-4627-92D3-FBA54C815689
Hardware Event-based Sampling Collection with Stacks
Configure the event-based sampling collector to analyze call stacks for your functions and identify performance, parallelism and power consumption issues.
For Linux* targets, make sure your kernel is configured to support event-based stack sampling collection.
Multitask operating systems execute all software threads in time slices (thread execution quanta). Intel® VTune™ Profiler profiler handles thread quantum switches and performs all monitoring operations in correlation with the thread quantum layout.
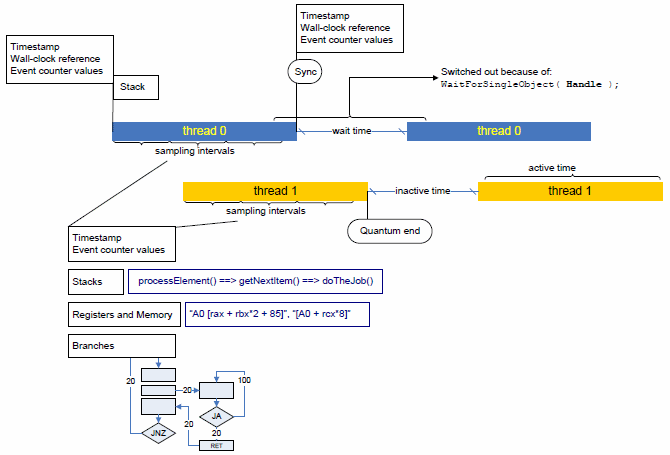
The figure below explains the general idea of per-thread quantum monitoring:

The profiler gains control whenever a thread gets scheduled on and then off a processor (that is, at thread quantum borders). That enables the profiler to take exact measurements of any hardware performance events or timestamps, as well as collect a call stack to the point where the thread gets activated and inactivated.
The profiler determines a reason for thread inactivation: it can either be an explicit request for synchronization , or a so-called thread quantum expiration, when the operating system scheduler preempts the current thread to run another, higher-priority one instead.
The time during which a thread remains inactive is also measured directly and differentiated based on the thread inactivation reason: inactivity caused by a request for synchronization is called Wait time, while inactivity caused by preemption is called Inactive time.
While a thread is active on a processor (inside a quantum), the profiler employs event-based sampling to reconstruct the program logic and associate hardware events and other characteristics with the program code. Unlike the traditional event-based sampling, the profiler upon each sampling interrupt also collects:
call stack information
branching information (if configured so)
processor timestamps
All that allows for statistically reconstructing program execution logic (call and control flow graphs) and tracing threading activity over time, as well as collecting virtually any information related to hardware utilization and performance.
Configure Stack Collection
Click the
 Configure Analysis button on the VTune Profiler toolbar.
 The Configure Analysis window opens.
Specify your analysis system in the WHERE pane and your analysis target in the WHAT pane.
In the HOW pane, choose the required event-based sampling analysis type. Typically, you are recommended to start with the Hotspots analysis in the hardware event-based sampling mode.
Configure collection options, if required. For call stack analysis, consider enabling the Collect stacks option.
Click the Start button at the bottom to run the selected analysis type.
VTune Profiler collects hardware event-based sampling data along with the information on execution paths. You may see the collected results in the Hardware Events viewpoint providing performance, parallelism and power consumption data on detected call paths.
The event-based stack sampling data collection cannot be configured for the entire system. You have to specify an application to launch or attach to.
By default, on Linux* systems, VTune Profiler uses the driverless Perf*-based mode for hardware event-based collection with stacks. To use the driver-based mode, set the Stack size option to 0 (unlimited).
Call stack analysis adds an overhead to your data collection. To minimize the overhead incurred with the stack size, use the Stack size option in the custom hardware event-based sampling configuration or -stack-size knob from CLI to limit the size of a raw stack. By default, on Linux a stack size of 1024 bytes is collected. On Windows, by default, a full size stack is collected (zero size value). If you disable this option, the overhead will be also reduced but no stack data will be collected.
Analyze Performance
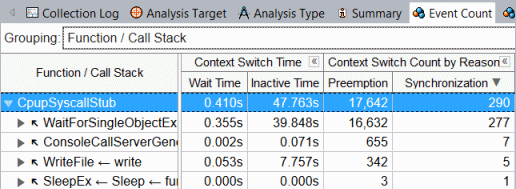
Select the Hardware Events viewpoint and click the Event Count tab. By default, the data in the grid are sorted by the Clockticks (CPU_CLK_UNHALTED) event count providing primary hotspots on top of the list.
Click the plus sign to expand each hotspot node (a function, by default) into a series of call paths, along which the hotspot was executed. VTune Profiler decomposes all hardware events per call path based on the frequency of the path execution.

The counts of the hardware events of all execution paths leading to a sampled node sum up to the event count of that node. For example, for the CpupSyscallStub function, which is the top hotspot of the application, the INST_RETIRED.ANY event count equals the sum of event counts for all 5 calling sequences: 25 700 419 203.
Such a decomposition is extremely important if a hotspot is in a third-party library function whose code cannot be modified, or whose behavior depends on input parameters. In this case the only way of optimization is analyzing the callers and eliminating excessive invocations of the function, or learning which parameters/conditions cause most of the performance degradation.
Explore Parallelism
When the call stacks collection is enabled (for example, Collect stacks option for the Hotspots in the hardware event-based sampling mode), the VTune Profiler analyzes context switches and displays data on the threads activity using the context switch performance metrics.
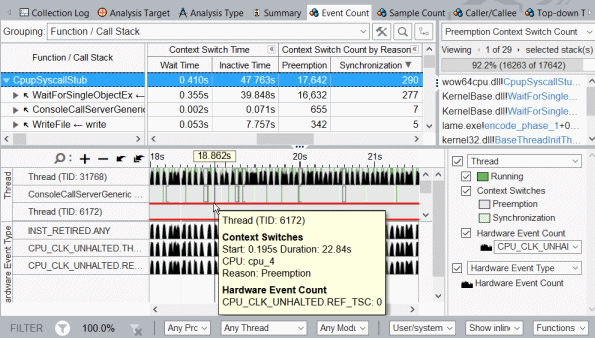
Click the Context Switch by Reason > Synchronization column header to sort the data by this metric. The synchronization hotspots with the highest number of context switches and high Wait time values typically signals a thread contention on this stack.

Select a context switch oriented type of the stack (for example, the Preemption Context Switch Count type) in the drop-down menu of the Call Stack pane and explore the Timeline pane that shows each separate thread execution quantum. A dark-green bar represents a single thread activity quantum, grey bars and light-green bars - thread inactivity periods (context switches). Hover over a context switch region in the Timeline pane to view details on its duration, start time and the reason of thread inactivity.

When you select a context switch region in the Timeline pane, the Call Stack pane displays a call sequence at which a preceding quantum was interrupted.
You may also select a hardware or software event from the Timeline drop-down menu and see how the event maps to the thread activity quanta (or to the inactivity periods).
Correlate data you obtained during the performance and parallelism analysis. Those execution paths that are listed as the performance hotspots with the highest event count and as the synchronization hotspots are obvious candidates for optimization. Your next step could be analyzing power metrics to understand the cost of such a synchronization scheme in terms of energy.
For analyses using the Perf*-based driverless collection, the types of context switches (preemption or synchronization) may not be identified on kernels older than 4.17 and the following metrics may not be available: Wait time, Wait Rate, Inactive Time, Preemption and Synchronization Context Switch Count.
The speed at which the data is generated (proportional to the sampling frequency and the intensity of thread synchronization/contention) may become greater than the speed at which the data is being saved to a trace file, so the profiler will try to adapt the incoming data rate to the outgoing data rate by not letting threads of a program being profiled be scheduled for execution. This will cause paused regions to appear on the timeline, even if no pause was explicitly requested. In ultimate cases, when this procedure fails to limit the incoming data rate, the profiler will begin losing sample records, but will still keep the counts of hardware events. If such a situation occurs, the hardware event counts of lost sample records will be attributed to a special node: [Events Lost on Trace Overflow].