A newer version of this document is available. Customers should click here to go to the newest version.
Visible to Intel only — GUID: GUID-56E02EB1-53FE-11E6-B7EB-28D24465DA3C
Visible to Intel only — GUID: GUID-56E02EB1-53FE-11E6-B7EB-28D24465DA3C
GPU Utilization
Metric Description
The percentage of time when GPU engine was utilized.
VTune Profiler collects high level information about the GPU Utilization metric when you run the GPU Offload and GPU Compute/Media Hotspots analyses. This information is available in the GPU Offload viewpoint. To see more detailed metric information, rebuild the Linux kernel to enable i915 ftrace events.
Use the Summary, Platform, and Graphics window to explore the GPU utilization at the application and computing task level.
GPU Utilization in the Summary Window
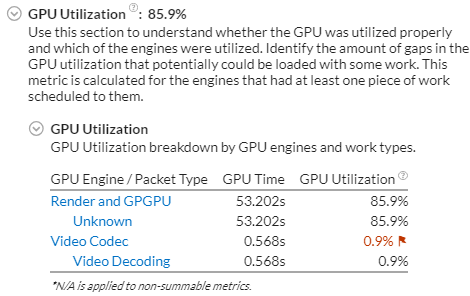
If your system satisfies configuration requirements for GPU analysis (i915 ftrace event collection is supported), VTune Profiler displays detailed GPU Utilization analysis data across all engines that had at least one DMA packet executed. By default, the VTune Profiler flags the GPU utilization less than 80% as a performance issue. In the example below, 85.9% of the application elapsed time was utilized by GPU engines.

Depending on the target platform used for GPU analysis, the GPU Utilization section in the Summary window shows the time (in seconds) used by GPU engines. Note that GPU engines may work in parallel and the total time taken by GPU engines does not necessarily equal the application Elapsed time.
You may correlate GPU Time data with the Elapsed Time metric. The GPU Time value shows a share of the Elapsed time used by a particular GPU engine. If the GPU Time takes a significant portion of the Elapsed Time, it clearly indicates that the application is GPU-bound.
If your system does not support i915 ftrace event collection, all the GPU Utilization statistics will be calculated based on the hardware events and attributed to the Render and GPGPU engine.
GPU Utilization in the Platform Window
Explore overall GPU utilization per GPU engine at each moment of time. By default, the Platform window displays GPU Utilization and software queues per GPU engine. Hover over an object executed on the GPU (in yellow) to view a short summary on GPU utilization, where GPU Utilization is the time when a GPU engine was executing a workload. You can explore the top GPU Utilization band in the chart to estimate the percentage of GPU engine utilization (yellow areas vs. white spaces) and options to submit additional work to the hardware.To view and analyze GPU software queues, select an object (packet) in the queue and the Intel® VTune™ Profiler highlights the corresponding software queue bounds:
Full software queue prevents packet submissions and causes waits on a CPU side in the user-mode driver until there is space in the queue. To check whether such a stall decreases your performance, you may decrease a workload on the hardware and switch to the Graphics window to see if there are less waits on the CPU in threads that spawn packets. Another option could be to additionally load the queue by tasks and see whether the queue length increases.
Possible Issues
GPU utilization is low. Consider offloading more work to the GPU to increase overall application performance.